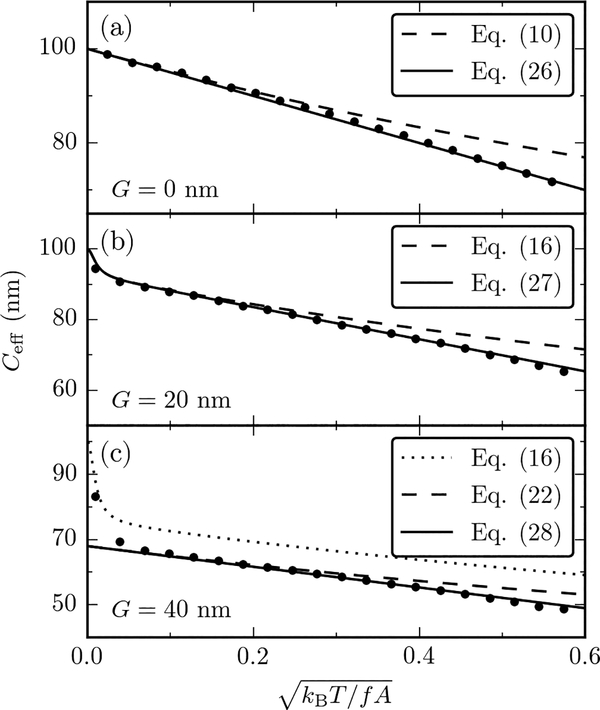
FIG. 3.
Comparison of Monte Carlo simulations of the triad model (points) with various analytical expressions of Ceff (lines) for A = 50 nm, C = 100 nm and (a) G = 0, (b) G = 20 nm] and (c) G = 40 nm. The data are plotted as a function of and correspond to f ≥ 0.25 pN. The numerical results are in excellent agreement with the analytical expressions, both in the perturbative and nonperturbative regimes (see text). Error bars of Monte Carlo data are smaller than symbol sizes.

