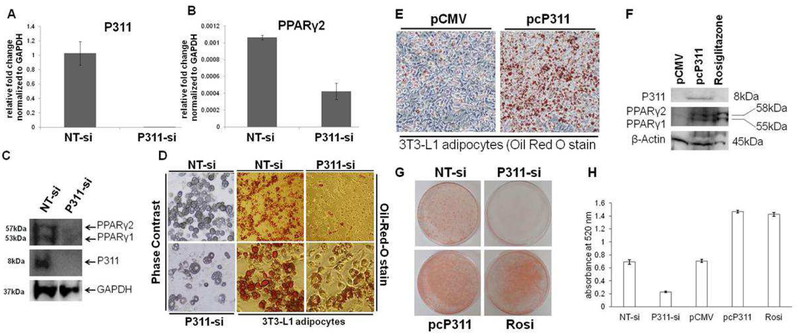
P311 knockdown inhibited 3T3-L1 adipogenesis and P311 overexpression promoted adipogenesis.
A and B. qPCR was used to measure P311 and PPARγ2 mRNA levels in cells induced to differentiate with either non-targeted siRNA (NT-si) or P311 siRNA. C. Western blot analysis of cell lysates of NT-si or P311-siRNA treated 3T3-L1 adipocytes. The lower panel represents the loading control (GAPDH). D. Left panel shows the phase contrast pictures of 3T3-L1 adipocytes treated with NT-si or P311-siRNA. Oil Red O staining was performed to assess lipid accumulation (middle and right panels). E. 3T3-L1 preadipocytes were transfected with control (pCMV) or P311 overexpression (pcP311) plasmid followed by adipogenic induction. Oil Red O staining is shown. F. Western blot analysis showed the overexpression of c-myc-tag-P311 immunodetected with anti-myc-tag-antibody. The P311 overexpression group showed elevated PPARγ expression compared to the control group. The lower panel represents the loading control (β-actin). G & H. Oil Red O staining (10 day postadipogenic induction) was performed to assess lipid accumulation and quantified the lipid accumulation.

