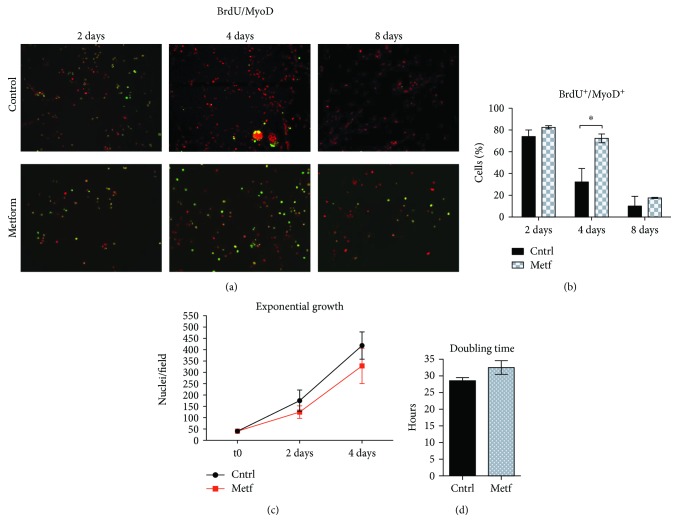
Figure 2.
Metformin delays SC cycle exit. (a) SCs were treated upon attachment for 2, 4, and 8 days with 2 mM metformin. 24 h before fixation, a BrdU labeling reagent was added to the culture medium and cells were further analyzed by fluorescence microscopy for the incorporation of BrdU and the expression of MyoD. (b) The percentage of cells expressing BrdU+/MyoD+ after 2, 4, and 8 days of treatment with metformin was calculated after three independent cell isolations and experimental replicates (n = 3). Statistical significance was evaluated by the ANOVA test (∗ p < 0.05). (c) Growth curve of control and metformin-treated SCs. SCs were treated with 2 mM metformin in vitro for 2 and 4 days, and the number of nuclei per field was counted by immunofluorescence microscopy. The initial number of plated cells was the same in each condition. The growth curves are derived from four independent biological replicates (n = 4). Statistical significance was evaluated by the ANOVA test (∗ p < 0.05). (d) Doubling time analysis of control and metformin-treated cells. The analysis was performed using the nonlinear regression/exponential growth equation tool in GraphPad Prism. The bar graph represents the average of four independent biological replicates (n = 4). Statistical significance was evaluated by Student's t-test (∗ p < 0.05).

