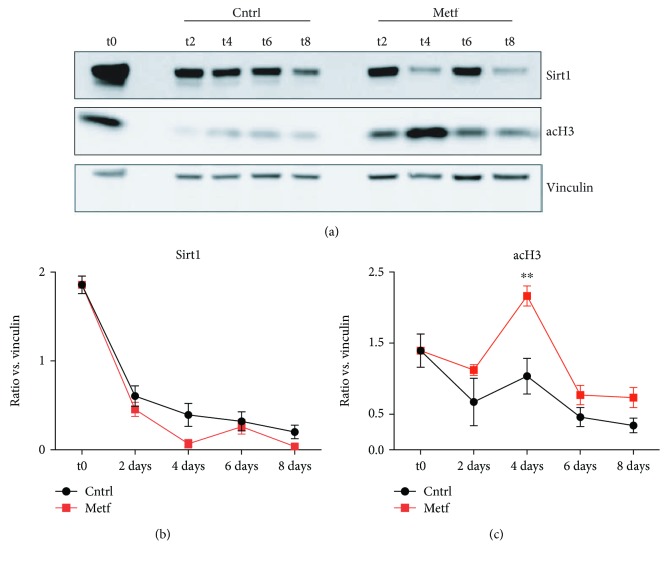
Figure 8.
Sirt1 levels in metformin-treated SCs. (a) Western blot analysis for the expression of Sirt1 and acH3 in control and metformin-treated SCs after 2, 4, 6, and 8 days of treatment (t2, t4, t6, and t8, respectively). Vinculin was used as a loading control. (b) Quantitation graph of Sirt1 protein levels monitored by western blot in four independent cell isolations and biological replicates (n = 4). Statistical significance was evaluated by the ANOVA test (∗ p < 0.05). (c) Quantitation graph of acH3 protein levels monitored by western blot in four independent cell isolations and biological replicates (n = 4). Statistical significance was evaluated by the ANOVA test (∗ p < 0.05).

