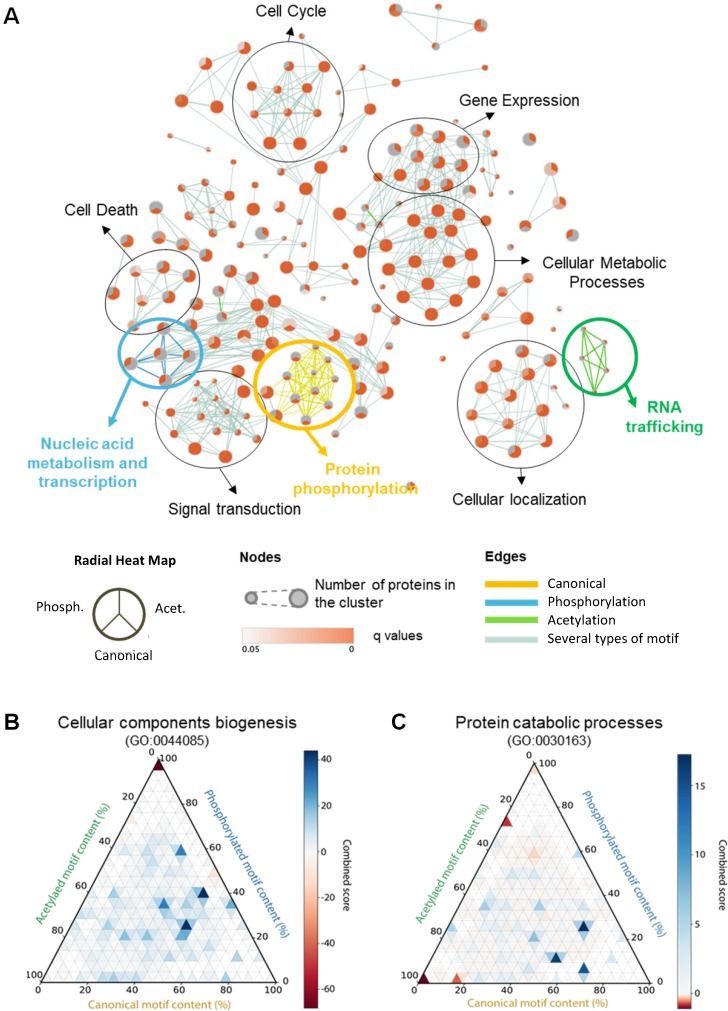
Fig 5. Enrichment of proteins with KFERQ-like motifs in biological processes.
(A) Enrichment map analysis of the association of proteins with KFERQ-like motifs with biological processes. The nodes are radial heat maps in which size shows the number of proteins within the given annotation and intensity of color indicates association with a specific kind of motif (the position of each type of motif in the radial heat map is indicated in the legend). Edges represent similarity between nodes, and color coded circles indicate clusters associated with a specific motif type (yellow for canonical, blue for phosphorylation-generated, and green for acetylation-generated motifs). (B,C) Enrichment for human proteins annotated under cellular components biogenesis (B) and under protein catabolic processes (C), grouped by relative content of KFERQ-like motif classes. For each protein, the fractional content (0% to 100%) of canonical, phosphorylation-, and acetylation-generated motifs is calculated. Proteins are binned by motif composition using a 5% bin size for each dimension. The combined score for enrichment (−loge(p-value)*z-score) of the proteins in each bin (small triangles within the plot area) is color coded from blue (low) to red (high). Acet., acetylation; Phosph., phosphorylation.

