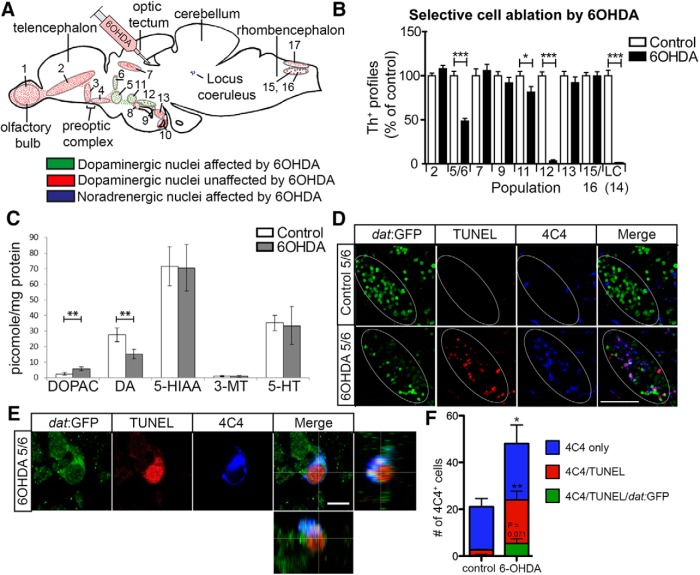
Figure 1.
Specific populations of TH+ neurons are ablated by 6-OHDA. A, A schematic sagittal section of the adult brain is shown with the 6-OHDA-resistant dopaminergic cell populations (red) and the vulnerable dopaminergic (green) and noradrenergic populations (purple) in relation to the injection site in the third ventricle indicated. B, Quantification of cell loss after toxin injection at 2 dpi is shown. C, Injection of the toxin decreases levels of dopamine (DA), increases levels of the metabolite DOPAC, but leaves serotonin (5-HT) and metabolites (5-HIAA, 3-MT) unaffected, as shown by HPLC. D, Sagittal sections of population 5/6 are shown in a dat:GFP transgenic fish. This shows elevated TUNEL and microglia labeling in population 5/6 after ablation. Note that areas of elevated TUNEL and microglial labeling follow the outlines of the dat:GFP+ cell population (ellipse) in the 6-OHDA-treated animals, but not in controls, indicating localized labeling. E, A high-magnification image is shown of a TUNEL+/dat:GFP+ dopaminergic neuron that is engulfed by a 4C4+ microglial process (lateral and orthogonal views). F, Quantification of microglial cells inside the 5/6 population (one 50 μm section through the 5/6 population from three animals each) is shown, with subgroups as indicated. Student's t test (with Welch's correction for heteroscedastic data) and Mann–Whitney U tests were used for pairwise comparisons in B, C, and F: *p < 0.05; **p < 0.01; ***p < 0.001. Error bars represent standard error of the mean. Scale bars: D, 50 μm; E, 5 μm.

