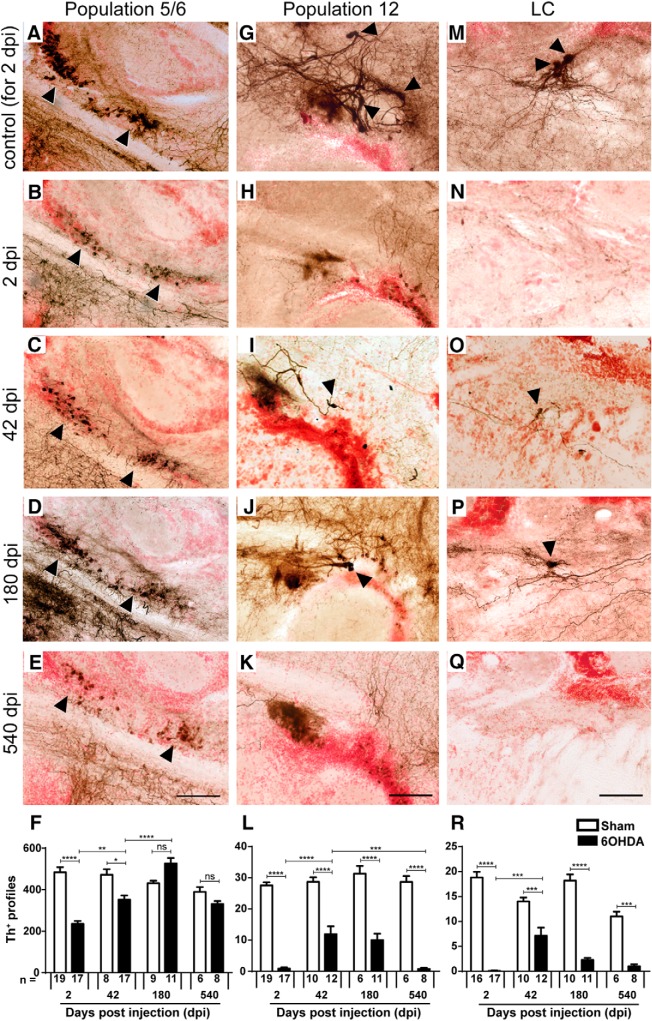
Figure 2.
Replacement of TH+ neurons differs between brain nuclei. Sagittal brain sections are shown; dorsal is up, rostral is left. Some TH+ cell bodies are indicated by arrowheads. The most representative images are shown, but quantifications are from one to three tissue sections (50 μm thickness), depending on the extent of the populations. A–F, In population 5/6, the number of TH+ cells is reduced after toxin-induced ablation and back to levels seen in controls without ablation by 180 dpi. G–L, In population 12, a partial and transient recovery in the number of TH+ cells was observed at 42 dpi. M–R, In the LC, there was also a partial and transient recovery of TH+ cell number. Note that example photomicrographs of controls are only shown for 2 dpi for clarity reasons, but all statistics were done with age-matched controls. F, L, R, Two-way ANOVA (p < 0.0001) with Bonferroni post hoc test: *p < 0.05, **p < 0.01, ***p < 0.001, ****p < 0.0001. Scale bars, 50 μm.

