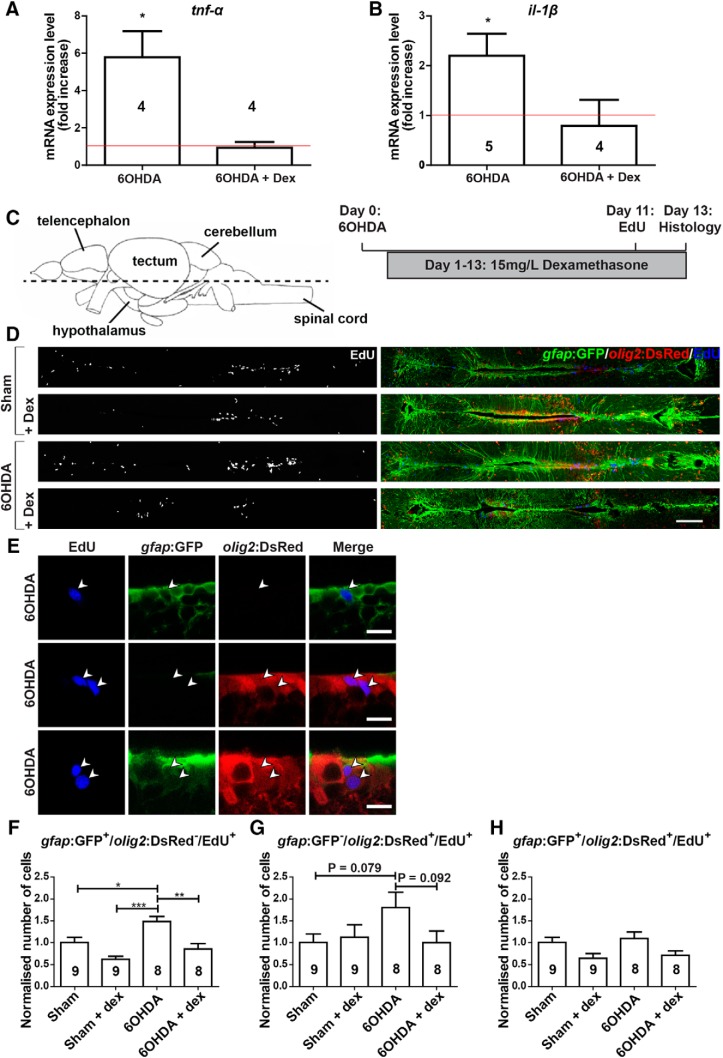
Figure 6.
6-OHDA injection increases ERG progenitor cell proliferation, which is abolished by dexamethasone treatment. A, B, Levels of il-1β (A) and tnf-α (B) are increased by 6-OHDA treatment at 3 dpi, but not in the presence of dexamethasone, as shown by qRT-PCR. Each condition is normalized to sham-injected fish (shown by the red line; one-tailed one-sample t tests, *p < 0.05). C, The section level of photomicrographs (left) and experimental timeline (right) are given for D–H. D, Overviews of the quantification areas are given. E, Higher magnifications of ventricular cells are given. EdU labels ERG progenitor cells that are only gfap:GFP+ (top row), only olig2:DsRed+ (middle row), or gfap:GFP+/olig2:DsRed+ (bottom row) are indicated by arrowheads. F–H, The proliferation rate in only gfap:GFP+ ERG progenitor cells is increased by 6-OHDA injection and brought back to control levels by dexamethasone treatment (F). A similar nonsignificant trend is observed for only olig2:GFP+ ERG progenitor cells (G), but not for double-labeled ERG progenitor cells (H). To facilitate comparisons between the different populations of ERG progenitor cells, changes induced by the treatments are normalized to the sham-injected group for each population. For F–H, One-way ANOVA with Bonferroni post hoc test: *p < 0.05, **p < 0.01, ***p < 0.001. Error bars represent S.E.M. Scale bars: D, 100 μm; E, 10 μm. Dex, Dexamethasone.

