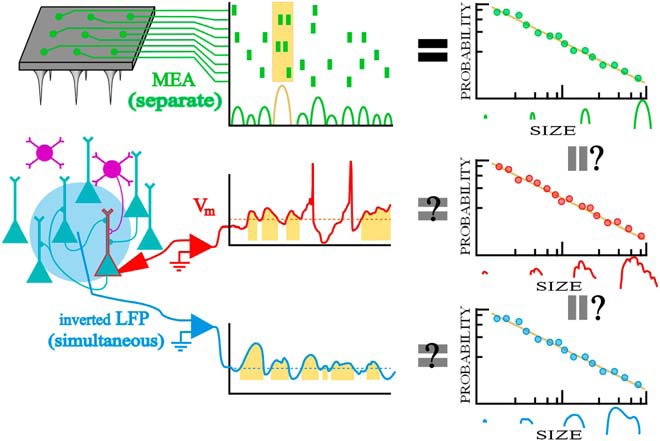
Figure 1.

Will fluctuations in somatic Vm and comparable signals reflect the scale-free nature of neuronal avalanches from microelectrode array data? A recurrent network with excitatory (teal) and inhibitory (purple) neurons is measured in three ways: MEA (green/top), whole-cell recording (red/middle), and LFP (blue/bottom). Neuronal avalanches (highlighted in gold) are inferred from the population raster and fluctuations are analyzed like avalanches for the Vm and inverted LFP signals. Neuronal avalanches are defined as spurts of activity with quiet periods between them for MEA or excursions above the 25th percentile for continuous nonzero data. The ultimate question is whether Vm fluctuations will recapitulate the entire neuronal avalanche analysis previously conducted on MEA data, including power laws in size and duration as well as a universal avalanche shape. This is abridged in the right-most column which illustrates power-law distributions.
