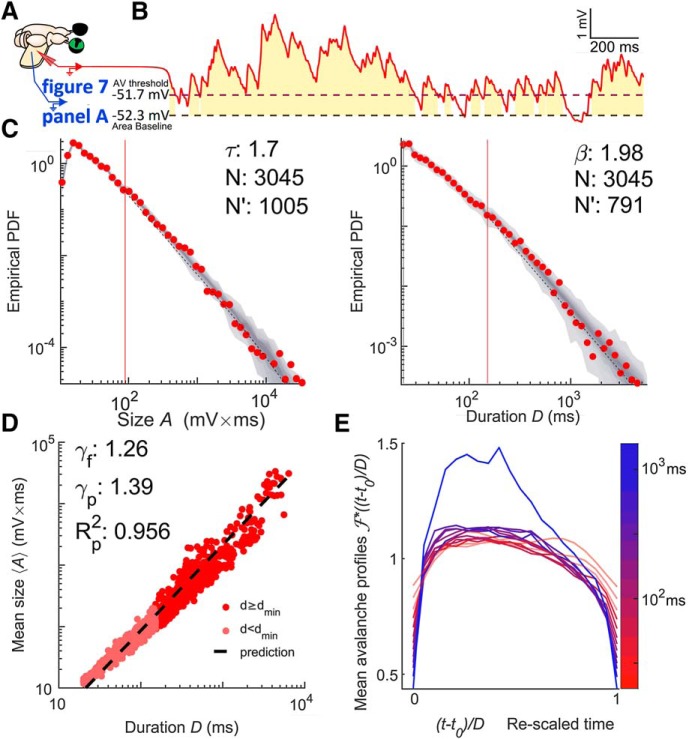
Figure 2.
Vm fluctuations reveal signatures of critical point dynamics. A, Whole-brain eye attached joint Vm and LFP recording preparation. B, Vm (red) thresholded at the 25th percentile (a dashed line). Avalanches are defined by excursions above this threshold. The gold region represents the size of the avalanche, which is the area between the signal and its second percentile (a dashed line). The duration of the avalanche is the duration of the excursion. C, Size (left) and duration (right) distributions of Vm inferred avalanches when data are combined from seven recordings from the same neuron falling in the same 20 min period. The comparison quotients (q) are both above 0.10 (0.878 and 0.874, respectively), indicating that the size and duration distributions were better fits to power laws at the given cutoff than 87% of power laws produced by a random number generator with the same parameters (shown as a gray density cloud). N′ indicates the number of avalanches above the lower cutoff of the fit (red vertical line) and N indicates the total number of avalanches. Size duration exponent denoted with τ and β is used for duration. D, Scaling relation is a function relating average avalanche size to each given duration. The predicted exponent (γp) successfully explains 95.6% of the variance of a log–log representation of the data. A linear least-squares regression could explain 96.7% and gives the fitted exponent (γf). Therefore, γp comes within 1.2% of the best linear explanation despite a 10% difference in exponent values. E, Shape collapse. Each line represents the average time course of an avalanch of a given duration. The color indicates the duration according to the scale bar. Durations below 50 ms (the lower bound on turtle pyramidal time constants) are made translucent and slightly thickened. This shape collapse represents the global collapse across all recordings in all cells. This confirms that a universal scaling function, , is present. For the seven recordings in the group represented in C and D, the mean scaling relation exponent derived from shape collapse was γSC = 1.23, a disagreement of 2.2% relative to γf.

