Figure 4.
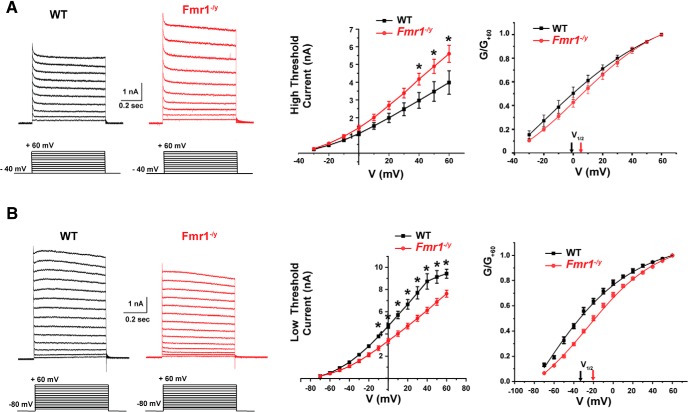
High- and low-threshold potassium currents are altered in MNTB neurons of Fmr1−/y mice. A, Representative whole-cell patch-clamp recordings of high-threshold potassium current evoked by holding the membrane potential at −40 mV for 2 min before stepping to test potentials between −30 and +60 mV in 10 mV increments. Middle, Plot shows that the amplitude of high-potassium current was significantly higher in MNTB neurons from Fmr1−/y mice compared with wild-type mice (two-way ANOVA, p < 0.0001). Right, Plot shows the corresponding normalized conductance that was not significantly (p = 0.16) different between WT and Fmr1−/y mice. B, Representative whole-cell patch-clamp recordings of low-threshold potassium current by holding the membrane potential at −80 mV before stepping to test potentials from −70 to +60 mV in 10 mV increments. Middle, Plots show that the peak amplitude of low-potassium current was significantly reduced in Fmr1−/y mice compared with WT mice (p < 0.0001, two-way ANOVA). Plot on the right shows a significant shift in voltage dependence of the low-threshold K+ conductance in Fmr1−/y mice (p = 0.01, Student's unpaired t test with Welch's correction). In the I–V plots, asterisks indicate statistical significance in post-test results for multiple comparisons (Holm–Sidak method).

