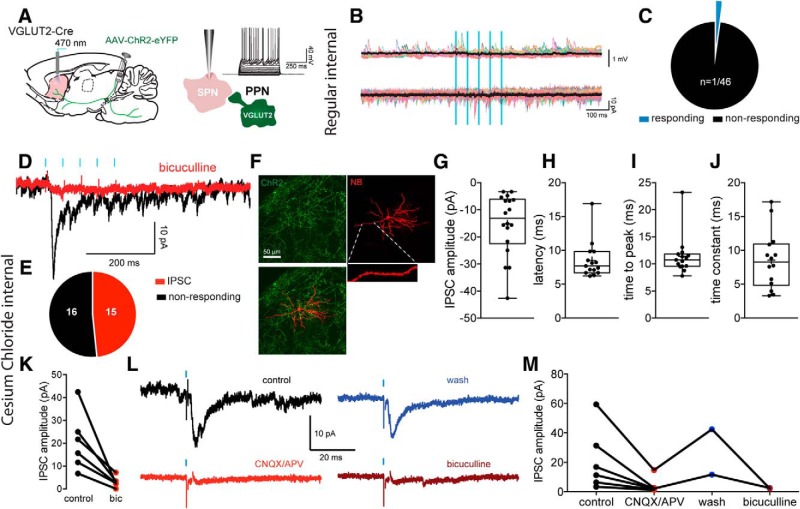
Figure 3.
Lack of innervation of SPNs by PPN glutamatergic neurons. A, Injection of a Cre-dependent ChR2-eYFP virus in the PPN of VGLUT2-Cre mice, and responses to somatic current injection in a representative SPN. B, Current-clamp (top) and voltage clamp (bottom, Vh = −70 mV) recordings of an SPN illustrating the lack of response to PPN optogenetic stimulation. Color traces represent individual trials. Black traces represent average. C, Pie chart of the percentage of SPNs responding to optogenetic stimulation of PPN glutamatergic striatal axons. The vast majority of recorded SPNs do not respond (97.8%, n = 45 of 46). D, Voltage-clamp responses of a SPN (Vh = −70 mV) to optogenetic stimulation of PPN glutamatergic striatal axons (5 pulses, 20 Hz), using high CsCl− internal (125 mm) to amplify inhibitory responses that are GABAA-mediated, as they are blocked by bicuculline (10 μm). E, Summary of SPN inhibitory responses. F, Biocytin-filled SPNs (red) surrounded by ChR2-expressing PPN glutamatergic terminals (green). G–J, Box plots of the amplitude (G), latency (H), time to peak (I), and time constant (J) of the inhibitory responses. The longer latency, consistent with a disynaptic effect. K, Quantification of bicuculline pharmacology (GABAA receptor antagonist, 10 μm, n = 6) on the IPSC amplitude. L, Voltage-clamp response of a SPN to stimulation of PPN axons (black, control). The response can be blocked by glutamate receptor antagonists (CNQX/APV, 10 μm, red, n = 6) as well as bicuculline (10 μm, brown) after wash (blue). M, Quantification of glutamatergic and GABAA pharmacology on the PPN-evoked response in SPNs. Box plots represent the minimum, maximum interquartile range, the mean, and median. Blue bars indicate optical stimulation.

