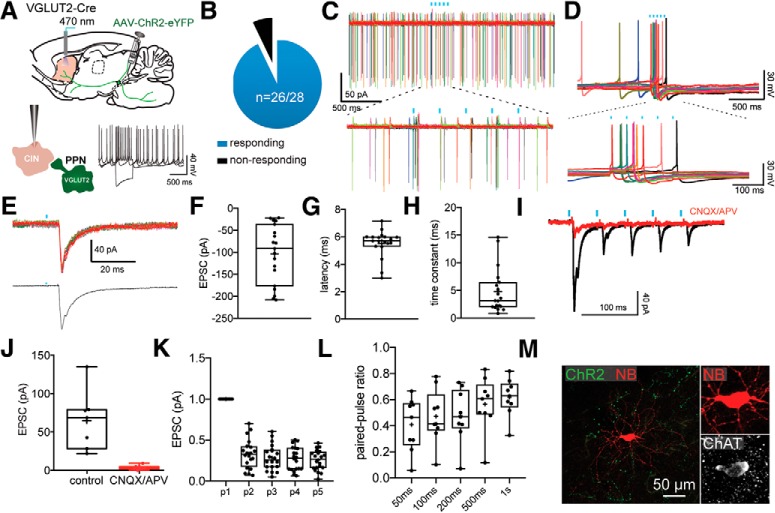
Figure 4.
Monosynaptic innervation of CINs by PPN glutamatergic neurons. A, Responses to somatic current injection of a representative CIN after transduction with a Cre-dependent ChR2-eYFP virus into the PPN of VGLUT2-Cre mouse. B, Pie chart of the percentage of CINs responding to optogenetic stimulation of PPN glutamatergic striatal axons. C, Cell-attached recording of a spontaneously active CIN. Bottom, The response to optogenetic stimulation is enlarged. D, Current-clamp recording of a spontaneously active CIN. Bottom, The response to optogenetic stimulation is enlarged. E, EPSC evoked by optogenetic stimulation of PPN glutamatergic striatal axons in a CINs. Top, Individual traces. Bottom, Average. F–H, Box plots showing the EPSC size, latency, and time constant. I, The EPSC induced by optogenetic stimulation is blocked by bath application of glutamate receptor antagonists (CNQX and APV, 10 μm). Quantification in box plot in J. K, Box plot quantifying the response to a train of 5 stimuli (20 Hz). Results are expressed as a PPR to the first EPSC. L, Box plot quantifying the response to a train of 2 stimuli (PPR) at different interstimulus intervals. Results are expressed as a PPRs. M, CIN filled with biocytin (red) surrounded by ChR2 terminals (green) colocalizing with ChAT immunostaining (white). Blue bars indicate optical stimulation.

