Figure 5.
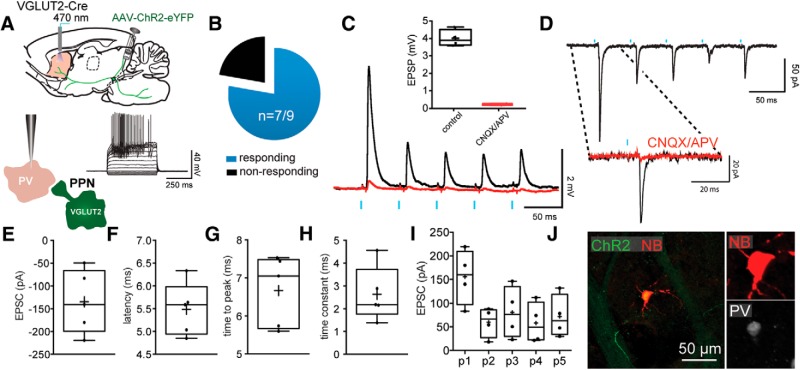
Monosynaptic innervation of FSIs by PPN glutamatergic neurons. A, Responses to somatic current injection in a representative FSI after transduction with a Cre-dependent ChR2-eYFP virus into the PPN of a VGLUT2-Cre mouse. B, Pie chart of the percentage of FSIs responding to the optogenetic stimulation of PPN glutamatergic striatal axons. C, Current-clamp recording of optogenetic stimulation of an FSI. The stimulation (5 pulses, 20 Hz) evoked EPSPs are blocked by CNQX and APV (10 μm), quantification in inset box plot. D, EPSCs in an FSI evoked by optogenetic stimulation of PPN glutamatergic axons. Inset, EPSC is blocked by CNQX and APV as in C. E–H, Box plots representing the EPSC size (E), latency (F), time to peak (G), and time constant (H). I, Box plots of the responses to a train of 5 stimuli at 20 Hz show the depressing nature of the EPSC. J, FSI filled with biocytin (red) surrounded by ChR2 terminals (green) colocalized with parvalbumin immunostaining (white). Blue bars indicate optical stimulation.

