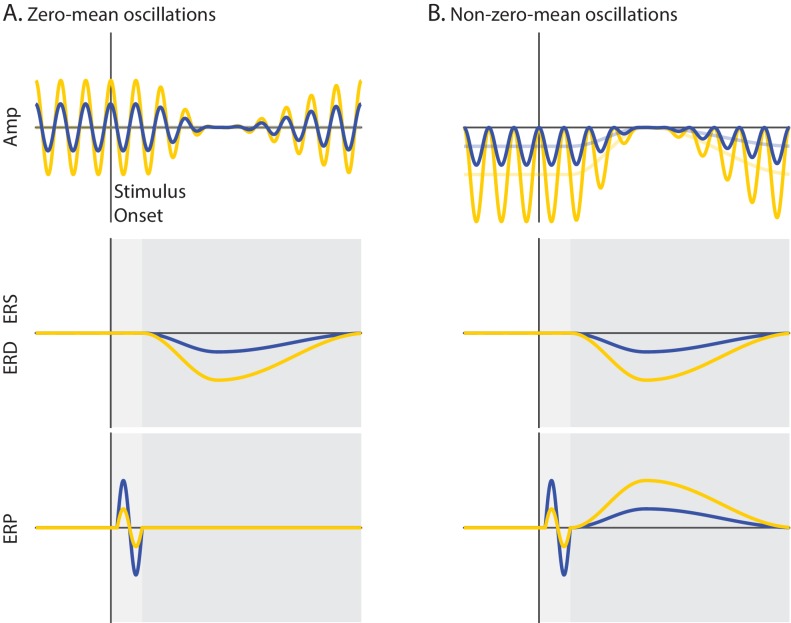
Figure 1. Schematic overview of the mechanisms of functional inhibition and baseline shift.
Ongoing activity (Amplitude), event-related oscillations (ERS/ERD) and potentials (ERP) are illustrated in upper, middle and lower panels, respectively. The vertical line indicates stimulus onset, while the horizontal line indicates zero signal strength. Yellow and blue represent states of strong and weak prestimulus power, respectively. (A) Non-phase-locked ongoing oscillatory activity with a zero-mean. The oscillations are symmetrical relative to the zero line of the signal (A upper panel). (B) Non-phase-locked ongoing oscillatory activity with a non-zero-mean. The oscillations are asymmetrical relative to the zero line of the signal. The signal baseline is characterized by a negative offset (opaque lines). The stronger the power of these oscillations, the stronger the negative offset of the signal baseline (B upper panel). During event-related desynchronization (ERD), the ongoing oscillations are suppressed to the zero line of the signal. This implies that the stronger the prestimulus power, the stronger the ERD (A/B middle panels). Trial averaging of zero-mean oscillations eliminates prestimulus oscillatory activity that is not time-locked to the stimulus because opposite oscillatory phases cancel out. This results in baseline signal at the zero line, which is unaffected by ERD. Therefore, an ERD of zero-mean oscillations does not generate the slow ERP component during the late time window because there is no baseline shift for these oscillations (dark gray; A lower panel). Trial averaging of non-zero-mean oscillations does not eliminate non-phase locked ongoing activity. This results in a prestimulus baseline signal with an offset relative to the zero line. During the ERD, the baseline of the signal gradually approaches the zero line of the signal. When the post-stimulus signal is corrected with the prestimulus non-zero baseline, a slow shift of the ERP signal appears, mirroring the ERD time-course. Specifically, an ERD of negative (positive) non-zero mean oscillations shifts the signal upward (downward), generating the slow ERP component of positive (negative) polarity. Crucially, the stronger the prestimulus power, the stronger the ERD, and as a consequence, the stronger the slow shift of the ERP. The baseline-shift account predicts a positive relationship between prestimulus power and the amplitude of the slow ERP during the late time window (dark gray; B lower panel). According to the functional inhibition account, strong prestimulus power attenuates the amplitude of the additive ERP components. This account predicts a negative relationship between prestimulus power and the amplitude of ERP components during the early time window (light gray; A/B lower panels).

