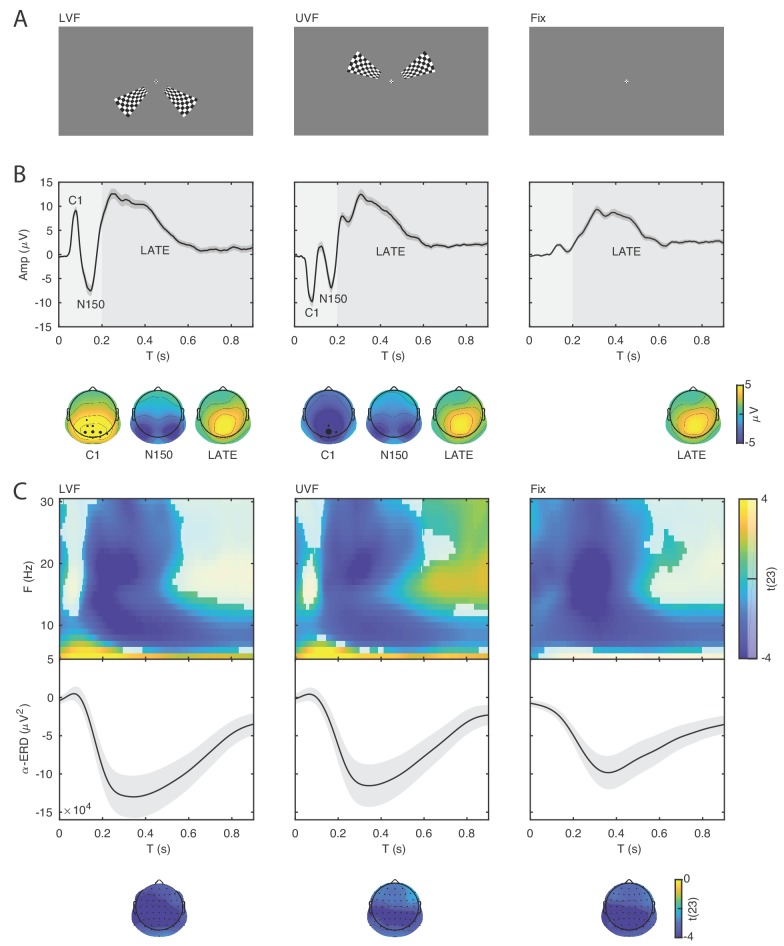
Figure 2. Event-related potentials and oscillations.
(A) The stimuli consisted of bilateral checkerboard wedges specifically designed to elicit the C1 component of the visual ERP. The stimuli appeared in the lower (left panel, LVF), upper visual field (middle panel, UVF), or in no field (right panel, Fix) with equal probability. Across trials, the participants were instructed to discriminate a central target during stimulus presentation. (B) Event-related potentials (ERP) were calculated for the subject-specific electrode with C1-peak activity. Additive ERP components are visible during the early time window (< 0.200 s, light grey). The C1 component is the earliest component of the visual ERP and is polarity-reversed across fields of stimulation (LVF vs. UVF). The C1 topography illustrates the ERP amplitude averaged at the subject-specific time point of peak activity between 0.055 and 0.090 s. The size of the electrodes in the topography indicates the frequency of the C1-peak electrode in the sample of participants. The C1 is followed by the N150, peaking between 0.130 and 0.180 s relative to stimulus onset. The N150 topography illustrates the ERP amplitude averaged between 0.130 and 0.180 s. Fix trials do not show any robust additive components during the early time window. The slow component of the ERP is visible during the late time window (> 0.200 s, dark gray). The topography of this late component illustrates the ERP amplitude averaged between 0.200 and 0.900 s. This late ERP component is present in all trial types. Time 0 indicates stimulus onset. (C) Group-level t-statistics maps of event-related oscillations. Negative values (blue) indicate significant power suppression across participants (ERD), while positive values (yellow) indicate significant power enhancement across participants (ERS). The maps are averaged across electrodes of the significant clusters, and masked by a final alpha of 0.05 using two-sided cluster permutation testing. The topography illustrates the group-level t-statistics averaged for the α frequency band (8–12 Hz) at the time point of most negative t-statistics. The bottom insets illustrate the group-level α-band ERD time course at occipital electrodes. The ERD is present in all trial types. Time 0 s indicates stimulus onset. Source data: the original source data are available at DOI: https://doi.org/10.5061/dryad.nm4241p.

