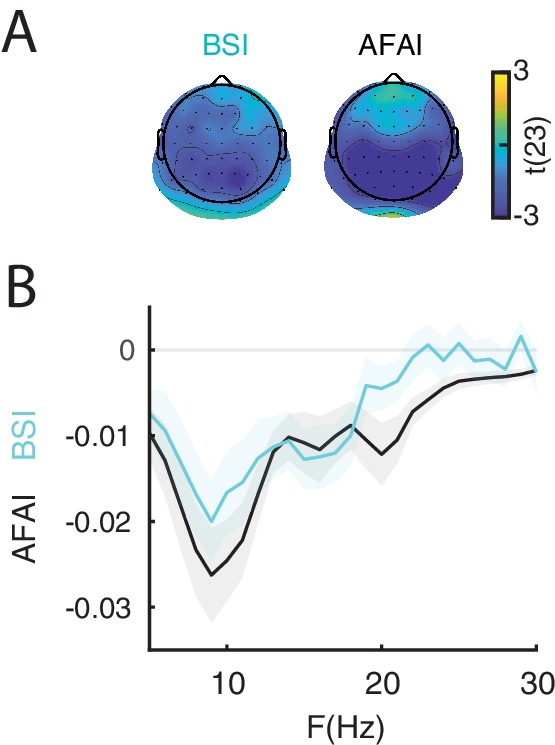
Figure 4. The non-zero mean property of resting-state neural oscillations is a prerequisite for the baseline-shift mechanism.

The late component of the ERP is generated by a baseline shift occurring during event-related desynchronization (ERD) of non-zero mean oscillations. (A) The amplitude fluctuation asymmetry index () is quantified as the normalized difference between the variance of the peaks and troughs of an oscillatory signal during resting state. (blue) indicates a stronger modulation of the troughs relative to the peaks, consistent with a negative mean. The topography represents the group-level t-statistics of : a significant negative cluster was found at frequencies between 5 and 30 Hz and with an occipito-parietal peak. The baseline shift index () is quantified as the correlation between the oscillatory envelope at a certain frequency and low-pass filtered EEG signal at 3 Hz during resting-state. (blue) indicate a negative relationship between oscillatory envelope and low-pass filtered signal, consistent with negative mean. The topography represents the group-level t-statistics of : a significant negative cluster was found at frequencies between 5 and 21 Hz and with an occipito-parietal peak. Black dots represent electrodes comprising the significant clusters. (B) Comparison between group-level (black) and (blue), averaged across respective cluster electrodes, and shown for each frequency. Shaded areas indicate ± SEM. These results indicate the presence of a negative oscillatory mean, consistent with the baseline-shift account.
