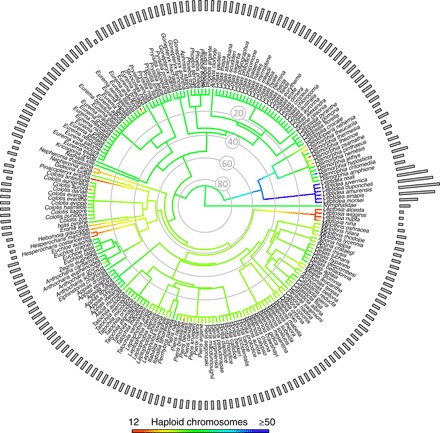
Fig. 4. Haploid chromosomal evolution across Pieridae.

Shown in the center is a genus-level phylogeny for Pieridae, colored by the ancestral state reconstruction of the chromosomal fusion and fission events giving rise to the haploid chromosome counts of the taxa, whose values are represented as a bar plot (n = 201 species). As only a time-calibrated genus-level phylogeny exists for Pieridae, all genera with >1 species were set to an arbitrary polytomy at 5 million years ago, while deeper branches reflect calibrated nodes. The outgroup is set to n = 31, reflecting the butterfly chromosomal mode. Note that while the color scale stops at 50, members of the Leptidea clade exceed this value.
