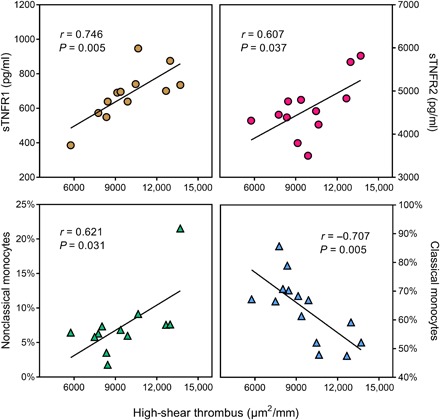
Fig. 2. Correlations of thrombus size with markers of inflammation.

Thrombus formation at high shear rate showed strong correlation with sTNFR1, sTNFR2, and nonclassical monocytes and a strong negative correlation with classical monocytes, tested using Pearson’s correlation.
