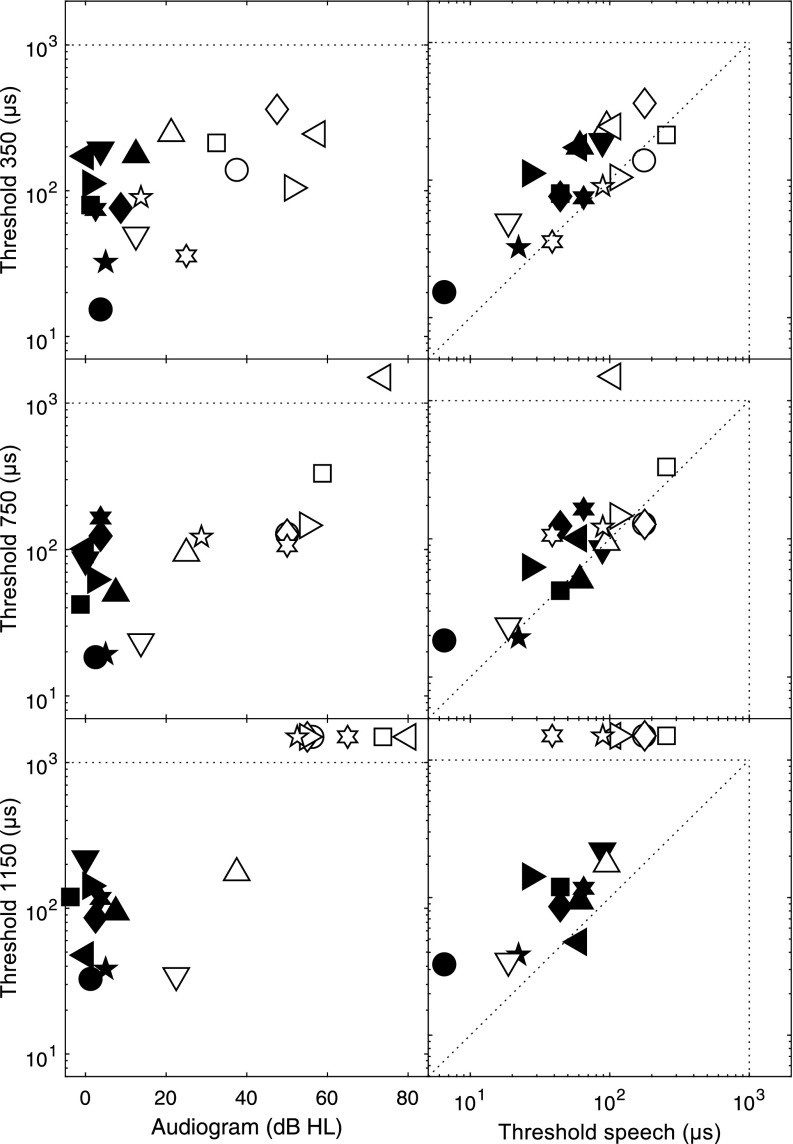
Fig. 2.
Left column: ITD thresholds for each pure tone stimulus as a function of audiometric thresholds at that frequency. Right column: ITD thresholds for each pure tone stimulus as a function of ITD thresholds for speech. In all panels, individual listeners are indicated by different symbols (NH: filled; HI: open), and symbols beyond the dotted boundary at 1 ms indicate unmeasurable thresholds.

