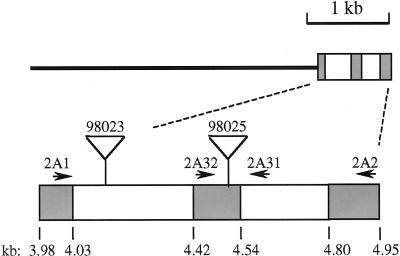
Figure 2.
Structure of the genomic sequence from the isolated clone (0–4.71 kb) and PCR products (4.71–5.08 kb). The thin line indicates the region 5′ of the known cDNA sequence. Shaded boxes indicate exons and open boxes indicate introns. Lower diagram includes Mutator insertion sites for lines 98023 (approximately position 4.135) and 98025 (between 4.507/4.508) as determined via size and sequence of PCR products. Diagram also indicates positions of Sbe2a-specific primers (2A1, 2A32, 2A31, and 2A2). Corresponding locations from the Sbe2a cDNA sequence are noted (cDNA bp).

