
Figure 1. Metabolic map of prdR regulated genes.
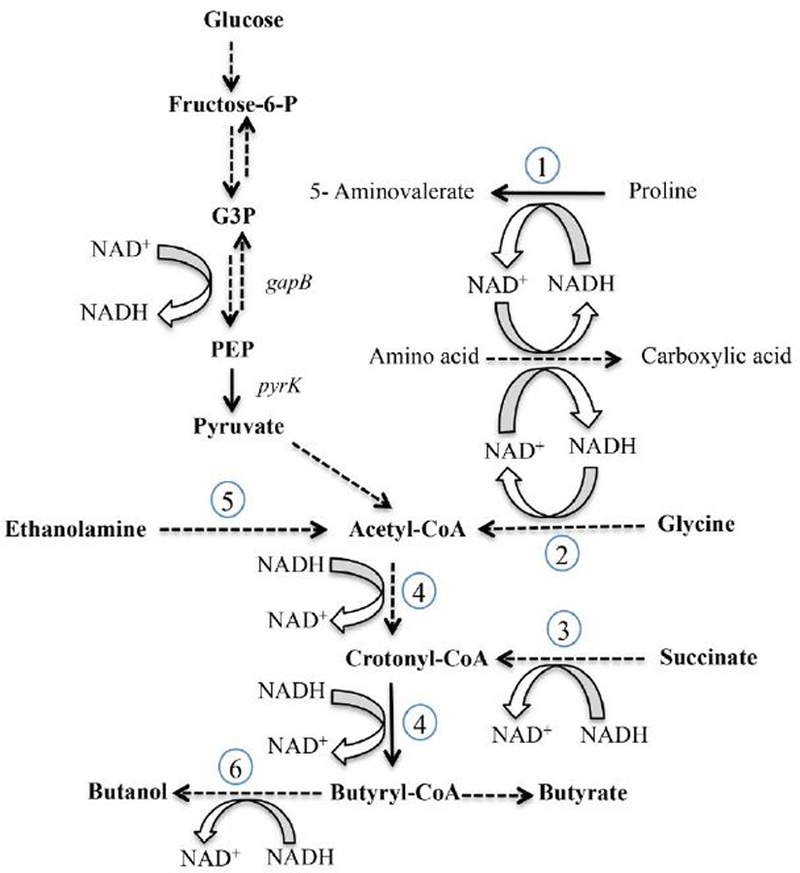
Conversion of glucose to pyruvate (glycolysis) and oxidation of amino acids to carboxylic acids (Stickland metabolism) generate NADH. Proline reductase (1), glycine reductase (2) and the succinate-acetyl CoA pathway to butyrate (3, 4) generate NAD+. Solid lines indicate single enzyme steps, whereas dotted lines indicate multienzyme steps in the pathways. Specific pathways and genes that encode the relevant enzymes are denoted as follows: (1) D-proline reductase (CD3236–3244, prd); (2) glycine reductase (CD2348-CD2358, grd); (3) succinate reduction (CD2344–CD2338); (4) conversion of acetyl CoA to butyryl CoA (CD1054–CD1059); (5) ethanolamine utilization (CD1906-CD1925, eut); and (6) alcohol dehydrogenase (CD2966, adhE). In the prdR mutant, the prd genes were underexpressed, but the other indicated pathways were all overexpressed at least 5-fold compared to the wild-type.