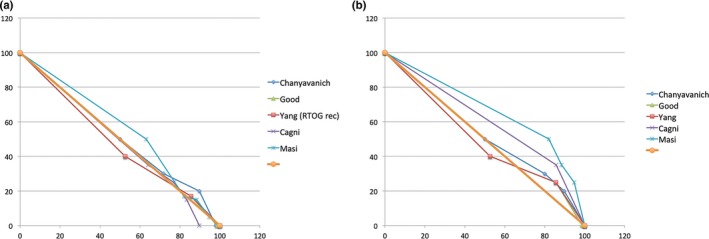
Figure 3.

Prescribed dose‐volume constraints used for manual planning. (a) Rectum constraints; (b) Bladder constraints. Notice that in each case, the diagonal line (thick brown) is a reasonable first‐order approximation of the dose‐volume histogram curve. [Color figure can be viewed at wileyonlinelibrary.com]
