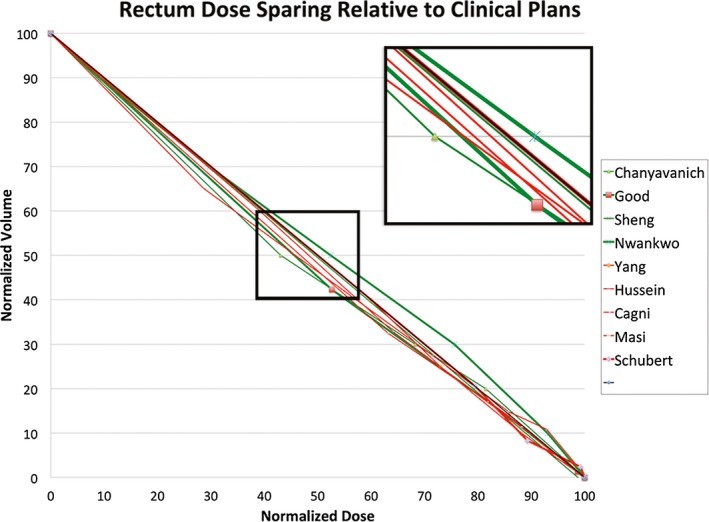
Figure 4.

Visualization of knowledge‐based planning (KBP) method performance in rectum dose sparing. The thick diagonal line in black is the proxy dosevolume histogram (DVH) curve of clinical plans. The green and red DVH curves represent the approximated average performance of the re‐planned cases in nine KBP studies relative to the clinical plans. The green curves indicate case/atlas‐based methods while the red curves indicate model‐based methods. The thicker lines indicate studies with 30 or more sample cases. [Color figure can be viewed at wileyonlinelibrary.com]
