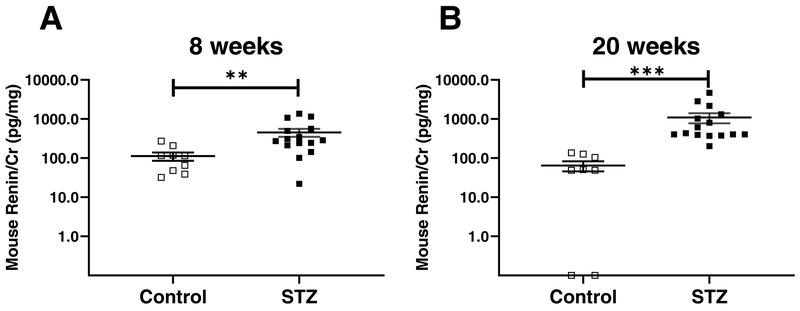
Figure 2. Mouse renin concentrations in non-diabetic and diabetic mice, 8 (A) and 20 weeks after the last STZ injection (B).
Panel A: higher mouse renin/Cr ratio in urines from diabetic FVB mice (STZ, black, n=15) compared to non-diabetic FVB mice (Veh, white, n=9) 8 weeks after the last injection of steptozotocin. Panel B: higher mouse renin/Cr ratio in urines of diabetic FVB mice (STZ, black, n=15) compared to non-diabetic FVB mice (Veh, white, n=8) 20 weeks after the last injection of streptozotocin. Data shown as mean ± SE. Veh: control mice treated with vehicle; STZ: Streptozotocin-treated mice; **p<0.01, ***p<0.001

