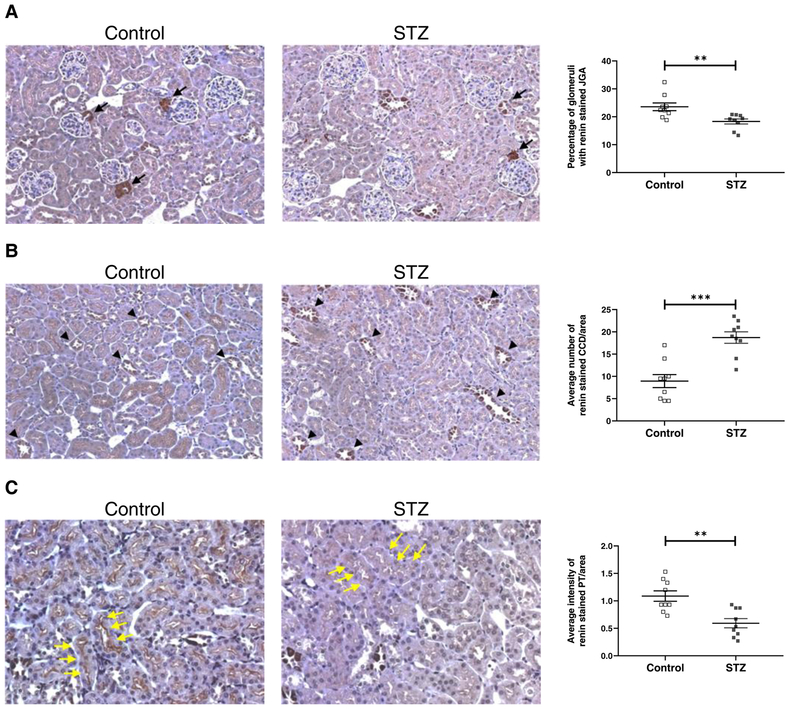
Figure 4. Kidney renin immunostaining in non-diabetic and diabetic FVB mice and semiquantitative analysis of staining in the JGA (A), CCD (B) and PT (C).
A: Immunostainining for renin shows a significant decrease of the percentage of glomeruli with stained JGA (black arrows) in diabetic FVB kidneys (STZ) compared to non-diabetic FVB kidneys (Control). B: Immunostaining for renin shows a significant increase of the average number of stained CCD per area (black tip) in kidneys of diabetic FVB mice compared to non-diabetic FVB mice. C: Immunostaining for renin shows a significant decrease of the average intensity of stained PT per area (yellow arrow) in diabetic FVB kidneys compared to non-diabetic FVB kidneys. STZ: streptozotocin-treated mice; JGA: juxtaglomerular apparatus; CCD: cortical collecting duct; PT: proximal tubule; n=9 in each group;

