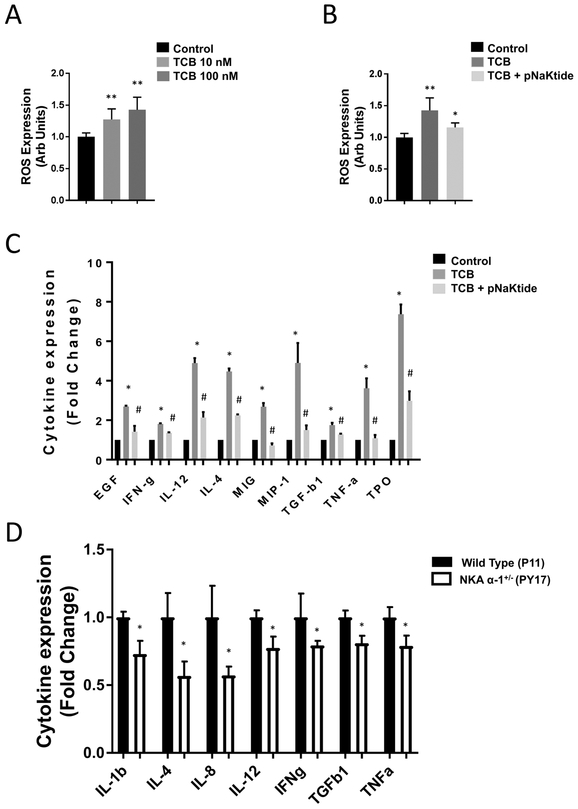
Figure 1.
Telocinobufagin (TCB) induced inflammatory response in renal proximal tubule cells is attenuated in the Na+/K+-ATPase α−1 (NKA α−1) knock-down cell line and after treating the wild type cell line with pNaKtide. (A) Dose dependent effect of TCB (10nM and 100nM) on ROS expression levels (n=8). (B) Blocking Src kinase using pNaKtide 1μM attenuates TCB (100 nM) induced ROS expression (n=8). (C) TCB (10 nM) induced inflammatory cytokine expression in renal epithelial cells is attenuated via pretreatment with Src kinase inhibitor pNaKtide 1μM (n=3). The full list of all measured cytokines is shown in Supplementary Table S1. (D) Reduction of Na+/K+-ATPase α−1 in the NKA α−1+/− renal epithelial cells attenuates TCB (10 nM) induced inflammatory cytokines expression compared to WT renal epithelial cells (n=4). The full list of all measured cytokines is shown in Supplementary Table S2. *p<0.05 vs. control, **p<0.01 vs. control, #p<0.05 vs. pNaKtide, ##p<0.01 vs. pNaKtide.

