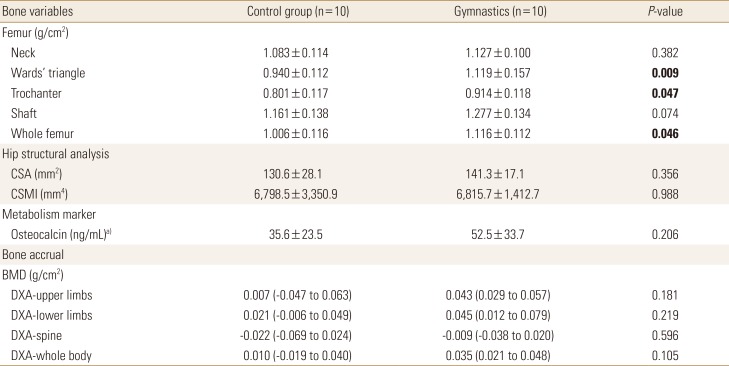
Table 2. Comparisons of bone density, geometry and metabolism between girls engaged and not engaged in artistic gymnastics (n=20; Analysis of Behaviors of Children During Growth Study).
The data is presented as mean±standard deviation or mean (95% confidence interval). Significant difference (P<0.05) in bold.
a)Due to non-parametric distribution, variable expressed as median and interquartile range and compared with Mann-Whitney's test.
CSA, cross-sectional area; CSMI, cross-sectional moment of inertia; BMD, bone mineral density; DXA, dual energy X-ray absorptiometry.

