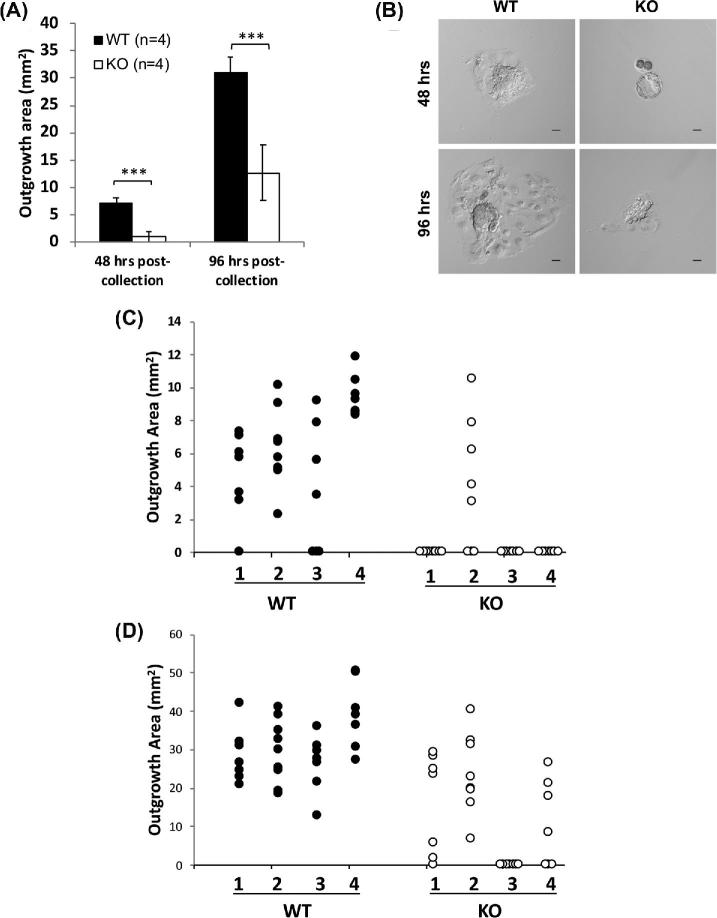
Figure 6.
In vitro growth of GD3.5 embryos from WT and Aire-KO mice. GD3.5 embryos were cultured on collagen-coated plates for 48 and 96 h, and outgrowth area quantified by phase-contrast microscopy. All images were taken using a 10× objective. (A) Average outgrowth area of embryos recovered from four WT and four KO dams. ***, P < 0.0001, Student's t-test. (B) Representative images of embryos recovered from WT and KO dams at 48 and 96 h of culture. (C) Area measurements of embryonic trophoblast outgrowth from WT and Aire-KO dams at 48 h postcollection. (D) Similar to (C), except at 96 h postcollection. Numbers on x-axis in C and D represent individual dams, while each data point represents individual embryos. Images were captured at 200× magnification; scale bar, 50μm.

