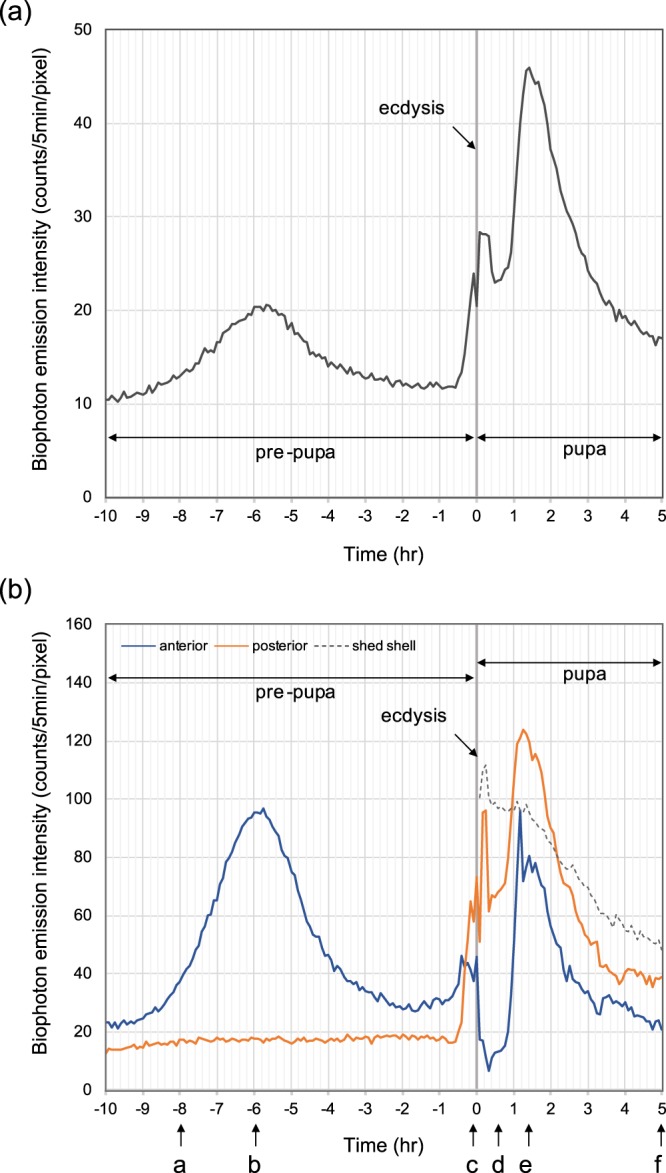
Figure 1.

Time course of biophoton emission intensity of Papilio protenor from 10 hr before pupal ecdysis to 5 hr after ecdysis. (a) Intensity time course of the whole body of the subject. (b) Intensity time course from the anterior region (blue line) and posterior region (orange line). After ecdysis, photon emission from a shed-shell is also shown (dotted line). Characters a–f with arrows denote the time points of biophoton images displayed in Fig. 2.
