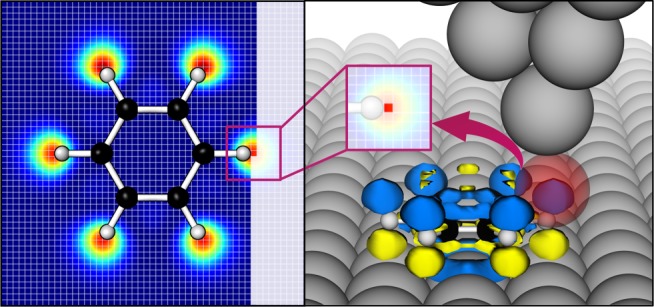
Fig. 1.

Schematic representation of locally integrated Raman polarizability density. The Raman polarizability density of the normal mode at 664 cm−1 of a benzene molecule is illustrated by isosurface (right panel). The density distributions in blue and in yellow hold the positive and negative signs, respectively. The red sphere denotes the confined near-field distribution at its FWHMs. The Raman polarizability densities in the red sphere are drastically enhanced and spatially integrated giving rise to a Raman intensity (symmetric bending) at 664 cm−1 (in insert). TERS image is generated from locally integrating Raman polarizability density by tip scanning over a benzene molecule (left panel)
