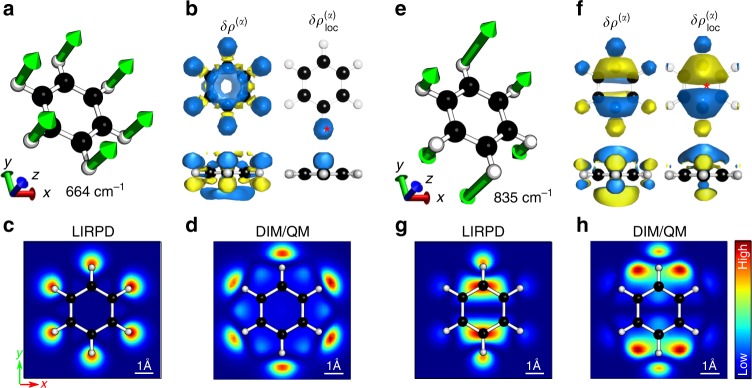
Fig. 2.
Normal modes, Raman polarizability densities, and TERS images of benzene. Normal modes a–d at 664 cm−1 and e–h at 835 cm−1. a, e Schematic representation of molecular vibrations. b, f Raman polarizability density (left column) and locally enhanced Raman polarizability density (right column) by a near field at the marked position (red asterisk) from the top view (top) and side view (bottom). The density is normalized and the absolute isovalue is set to 0.2 with the positive sign in blue and the negative sign in yellow. Simulated TERS images obtained by LIRPD in c, g, and the hybrid atomistic DIM/QM in d, h, respectively

