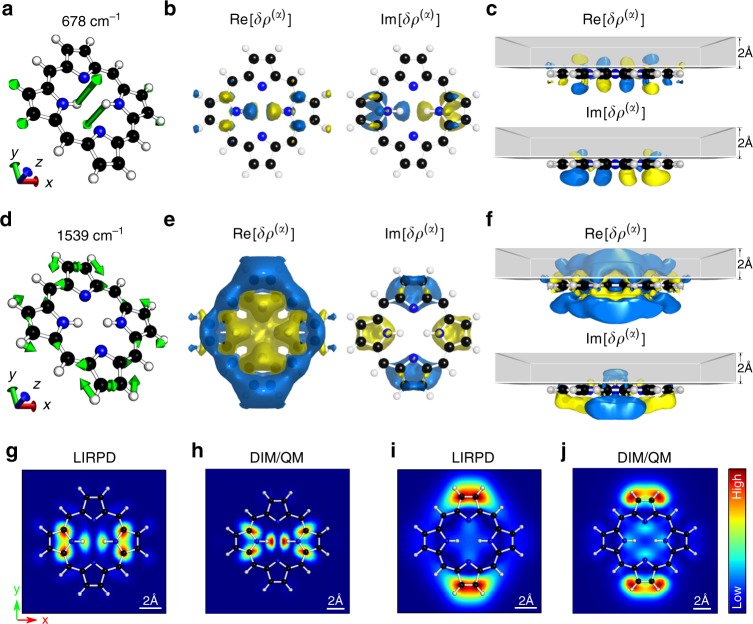
Fig. 3.
Normal modes, Raman polarizability densities, and TERS images of porphyrin. a–c Normal modes at 678 cm−1 and d–f at 1539 cm−1. a, d Schematic representation of molecular vibrations. b, e The Raman polarizability densities in real (left) and imaginary (right) parts of porphyrin on a Au(111) surface from the top view. c, f The Raman polarizability densities are distributed throughout the scanning volume with the thickness of 2 Å above porphyrin plane from the side view. The densities are normalized and the absolute isovalue is set to 0.2 with the positive sign in blue and the negative sign in yellow. Simulated TERS images of modes at 678 cm−1 (g, h) and 1539 cm−1 (i, j) obtained by LIRPD (g, i) and DIM/QM approaches (h, j), respectively

