Fig. 3.
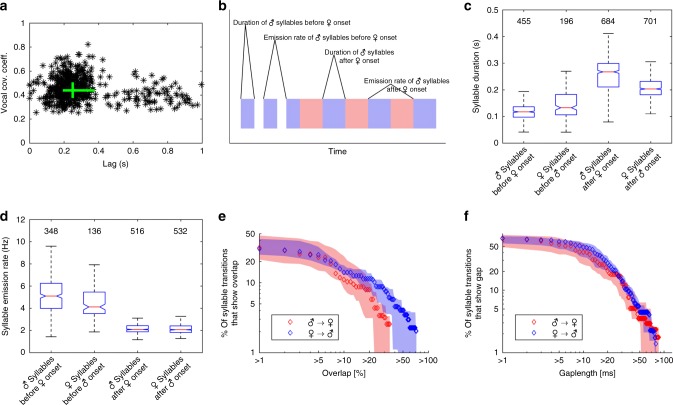
Quantification of temporal properties of vocal activity during duetting. a Time lags of maximum cross-covariance between male and female vocal signals (root-mean-square envelopes) during 554 duet bouts produced by 8 bird pairs were clustered at approximately 250 ms. The green lines indicate interquartile ranges of lags and cross-covariance coefficients, and their intersection is at the medians of the distributions. b Cartoon of a male-initiated duet bout defining the temporal duet properties that are displayed in c, d. Blue and red rectangles represent male and female duet syllables, respectively. c The duration of syllables sung by a single bird before the second bird’s song onset was significantly shorter than the duration of syllables sung in alternation after the second bird’s song onset. Furthermore, male duet syllables were significantly longer in duration than female duet syllables. In the boxplot, the horizontal red line indicates the median, and the bottom and top edges of the box indicate the 25th and 75th percentiles, respectively. The black whiskers extend to the most extreme data points not considered outliers (outliers are not shown). The extremes of the two notches of the box correspond to y − 1.57(z − x)/√n and y + 1.57(z − x)/√n, where y is the median, x and z are the 25th and 75th percentiles, respectively, and n is the number of observations. Medians are significantly different at the 5% significance level if the boxes’ notches do not overlap. d The emission rate of syllables sung by a single bird before the second bird’s song onset was significantly higher than the emission rate of syllables sung in alternation after the second bird’s song onset. Labeling of boxplots as in c. The median (seven pairs) percentage of duet syllable transitions that showed an overlap (e) or a gap (f) larger than the value on the x axis is marked by blue and red diamonds for female to male and male to female transitions, respectively. Shaded areas indicate the distributions’ interquartile ranges

