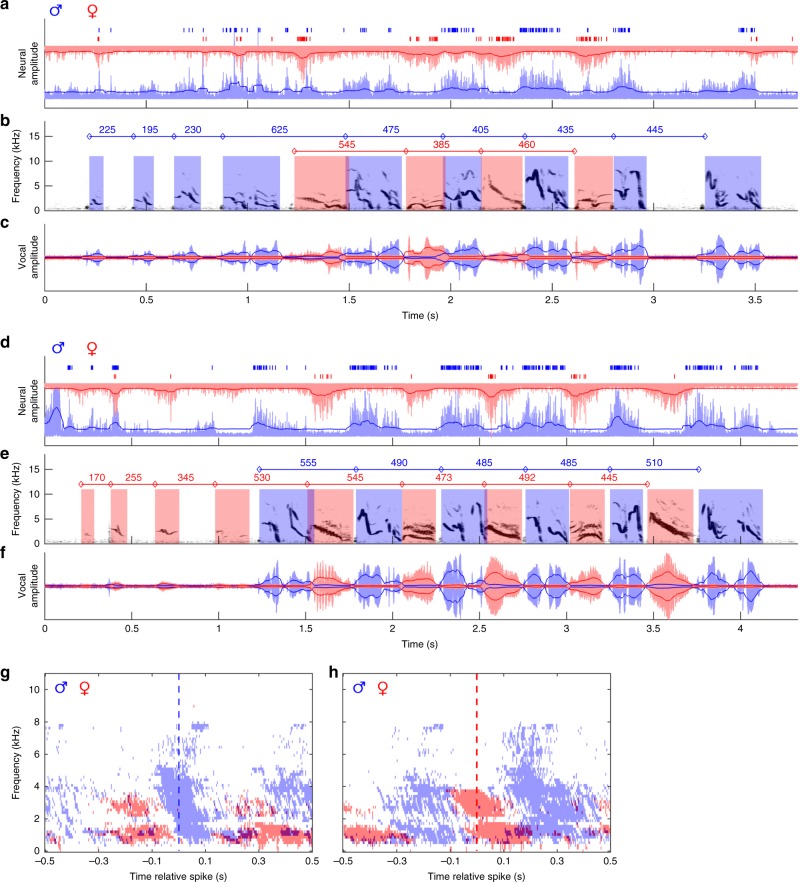
Fig. 4.
Vocalizations are locked to bursts of premotor HVC activity in the singing bird. Throughout, male signals are coded in blue and female signals are coded in red. The filtered and rectified male and female neural traces (a, d) and the spectrogram (b, e) and amplitude waveform (c, f) of the combined male and female vocal traces are shown for exemplary duet bouts initiated by the male (a) or by the female (d) of Pair #5. Solid dark blue and dark red lines outline the root-mean-square envelope (see “Methods”) of neural and vocal signals. Times of spike occurrence are indicated by short vertical lines above the neural traces. Onset–onset intervals of male and of female duet syllables are provided by values above the spectrograms. Please note the precise alternation of neural bursts between interacting males and females. Significant (p < 0.01, t test) activity in the averaged spectrogram (see “Methods”) of male and female vocal signals within a window of 500 ms before and after the time of occurrence of 3000 male (g) and 3000 female (h) spikes that occurred during 46 duet bouts of Pair #5 is shown by clusters of blue and red time–frequency pixels. The dashed blue and red lines mark the time of occurrence of male and female spikes, respectively, used for generation of the averaged spectrogram

