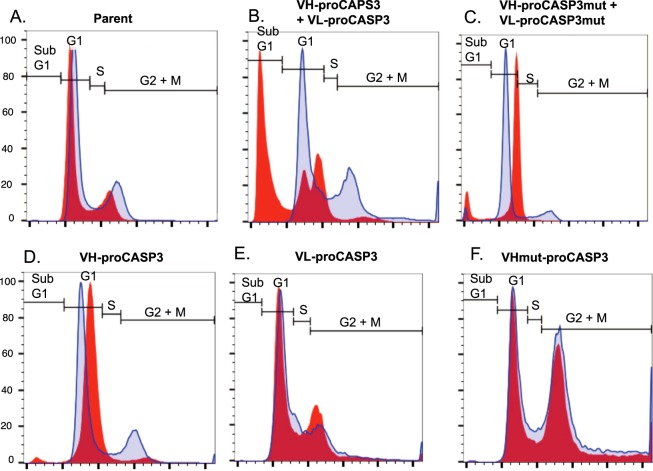
Figure 4.
Effect of the AIDA on cell cycle progression. The effect of expressing the VH/VL-proCASP3 proteins and their variants on the cell cycle was assessed by flow cytometry. Cells were induced for 48 hours, fixed, permeabilized, and stained with 7-AAD. Live, single cells were gated according to their size and granularity by forward and side scatter parameters. The normal cell cycle populations (G0/G1, S and G2/M phases) were set on the uninduced Parental cell line. Data are represented as overlaid histograms, with the cell cycle gates shown on each plot. The regions for subG1, G1, S and G2 + M phases are indicated. Blue trace = uninduced cells Red trace = tetracycline induced cells.

