Figure 5.
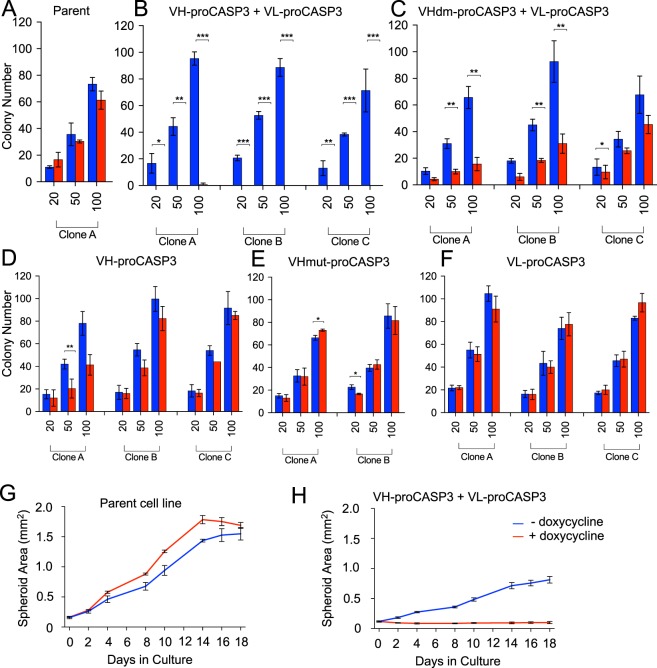
Cytotoxicity caused by VH-VL-procaspase3 using in vitro tumorigenicity models. Two types of in vitro assays were used to follow cytoxicity following VH-proCASP3 + VL-proCASP3 induction, namely a minimal dilution plating clonogenic assay (panels A–F) and a 3-D spheroid assay (panels G,H). In the plating assay, up to three clones of each type clones indicated (clones A–C) were plated at 20, 50 or 100 cells per dish (in triplicate) and grown for 9 days with and without doxycycline. Cell were fixed and stained with crystal violet for visualization. Colonies were graded as foci if they contained ≥10 cells. The bar charts show the averaged colony counts for each cell type in the presence of doxycycline (red bars) or absence (blue bars) of doxycycline. Panel A. Parental HT1080TetOn line; Panel (B). VH-proCASP3 + VL-proCASP3 clones (A–C); Panel (C). dematured VH VHdm-proCASP3 + VL-proCASP3 clones (A–C); Panel (D). VH-proCASP3 clones (A–C); Panel E. mutant VH VHmut-proCASP3 clones (A,B); Panel (F). VL-proCASP3 clones (A–C). Statistical significance of the data was determined by performing Student T-tests, where significant p values (<0.05) are indicated by the following key; *<0.05, **≤0.01 and ***≤0.001, where n = 3 readings per condition. Error bars represent standard deviation from the mean. The growth in spheroid development was measured over an 18 day period comparing the parent HT1080TetOn line (panel G) with the VH-proCASP3 + VL-proCASP3 clone (panel H). Images were taken and area measurements were analyzed by FIJI software34. Error bars represent standard deviation from the mean, with n = 4 for all conditions.

