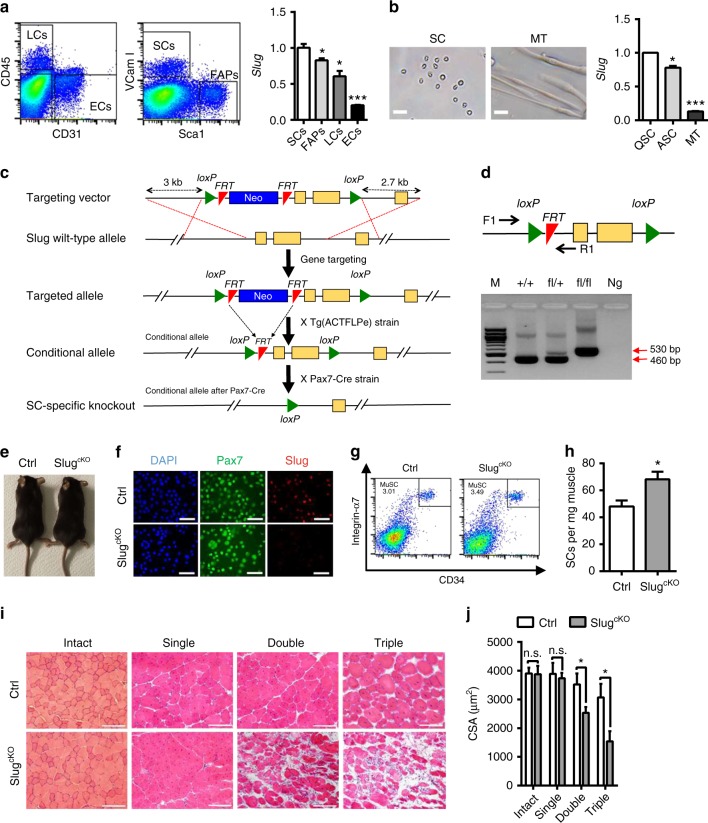
Fig. 2.
SC-specific Loss of Slug Impairs Muscle Regeneration. a Slug expression in different muscle resident cells. Left, representative flow cytometric gating of SCs (CD31−CD45−Scal1−Vcam I+), pan-lymphocytes (LCs, CD45+), epithelial cells (ECs, CD31+), and fibro-adipogenic progenitors (FAPs, CD31−CD45−Scal1+) from freshly prepared skeletal muscle cells. Right, qPCR analysis of Slug expression. *p < 0.05, **p < 0.01, ***p < 0.001 by student’s t-test. b Quantification of Slug expression in undifferentiated and differentiated SCs. Left, representative images of SCs and myotubes. Scale bar, 100 µm. Right, qPCR analysis of Slug expression. *p < 0.05, ***p < 0.001 by student’s t-test. QSC, quiescent satellite cell; ASC, activated satellite cells upon culture in growth medium for 3 days; MT, myotube. c Gene targeting strategy for generation of SC-specific Slug knockout mice. d Diagram of Slug-specific primer design for genotyping PCR. M. DNA marker; Ng negative control for PCR. e Comparison of adult Slugfl/flPax7Cre/+ (SlugcKO) and Slugfl/+Pax7Cre/+ (Ctrl). f Immunofluorescence staining of Slug in SCs of SlugcKO and Ctrl mice (n = 3 mice). Scale bar, 100 µm. g Frequency of SCs in SlugcKO and Ctrl mice. Similar results were seen from three independent flow cytometric analyses. h Yield of SCs per mg of muscle from Ctrl and SlugcKO mice (n = 3 mice for each genotype). *p < 0.05 by student’s t-test. i H&E staining of intact and injured TA muscles in SlugcKO and Ctrl mice (n = 5 mice per group). For single injury, TA muscles were harvested at day 10 after BaCl2 injection. For consecutive injury, mice with primary injury were recovered for 1 month followed by a second BaCl2 injection at the same sites. TA muscles were harvested 10 days after each injury. Scale bar, 100 μm. The experiment was repeated independently for three times with similar results. j Quantification of the myofiber CSA (µm2) shown in i. *p < 0.05 by student’s t-test (n.s., not significant). Data are shown as mean ± SEM of three independent replicates. Also see Supplementary Fig. 2 and 3. Source data are provided as a Source Data file

