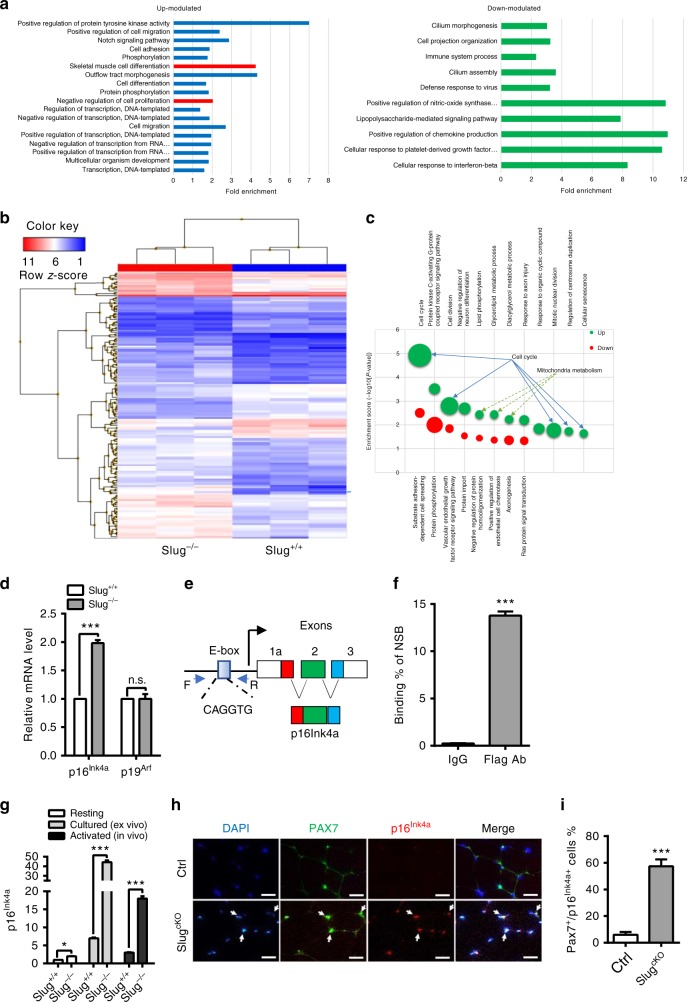
Fig. 4.
p16Ink4a is a direct target gene of Slug in SCs. a GOBP analysis of genes modulated in Slug-silenced myoblasts (GEO accession: GSE38236). The term of negative regulation of cell proliferation being highly relevant to observed self-renewal defect of Slug-deficient SCs in our study was highlighted in red. b Hierarchical clustering and heatmap representation of 168 differentially expressed genes separating Slug+/+ and Slug−/− SCs. Color pattern represents row Z-score. c Bubble chart showing results of GOBP analysis. Bubble size indicated number of genes associated with each term. GOBP ranked by fold enrichment score associated with upmodulated (green bubbles) and downregulated (red bubbles) signatures were selected for significance by using a false discovery rate cutoff of 5%. d qPCR analysis of p16Ink4a and p19Arf in primary SCs from Slug+/+ and Slug−/− mice (n = 3). n.s. not significant; ***p < 0.001 by student’s t-test. e Schematic diagram of the INK4a/ARF. The consensus Slug-binding site (E-box) is located in its promoter. f ChIP analysis of Slug occupancy at the p16Ink4a promotor. Primers targeting the 3’ untranslated region (without E-box elements) was used as a negative control for the ChIP assay. Relative binding affinity of Slug on the putative E-box element was quantified relative to the non-specific binding. ***p < 0.001 by student’s t-test. g Quantification of p16Ink4a in quiescent, ex-vivo culture- and in vivo injury-activated SCs from Slug+/+ and Slug−/− mice. For activation ex-vivo, SCs were cultured for 7 days; while for activation in vivo, SCs were harvested at day 10 after injury. *p < 0.05, ***p < 0.001 by student’s t-test. h IHC for p16Ink4a and Pax7 protein in SCs within the TA muscles of SlugcKO and Ctrl mice at day 30 post injury (n = 3 mice per genotype). Scale bar, 100 μm. i Percentage of Pax7 and p16Ink4a double positive SCs in h. ***p < 0.001 by student’s t-test. The experiments g–i were independently repeated three times with similar results. Data are shown as mean ± SEM of three independent experiments. Also see Supplementary Fig. 7-11. Source data are provided as a Source Data file

