Fig. 7.
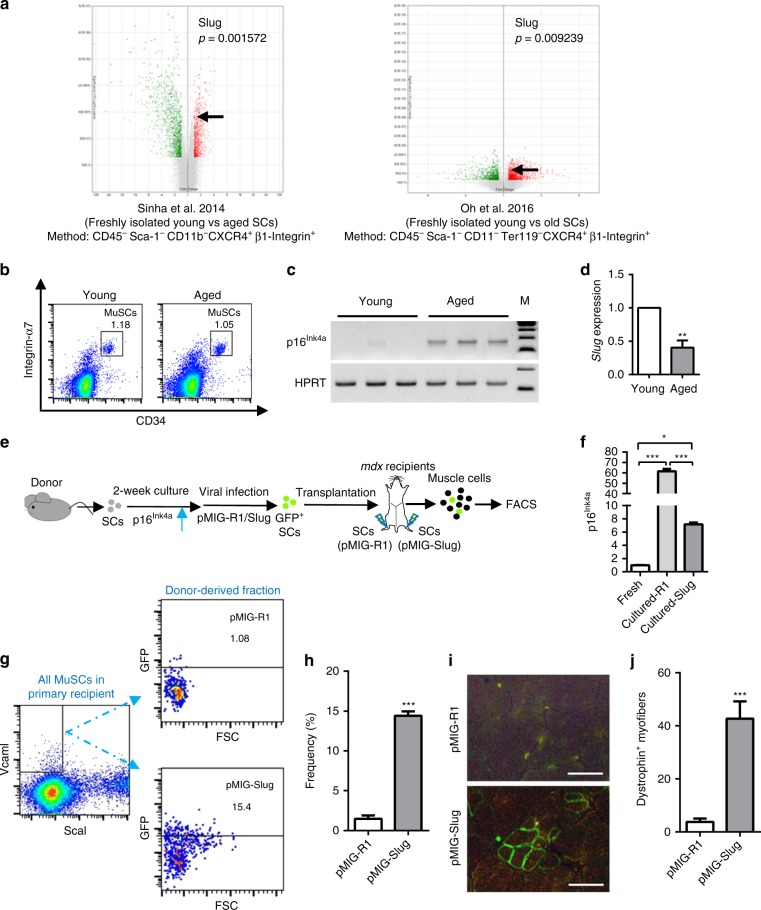
Slug Overexpression Restores Repopulating Capacity of Aged SCs. a Volcano plots demonstrating differentially expressed genes between freshly isolated young and aged SCs from the microarray data (GEO accession: GSE50821 and GSE72179) of indicated publications. Green dots indicate substantially increased while red dots indicated substantially decreased genes in aged SCs compared with young SCs. b Flow cytometric plotting of MuSCs (CD45−CD11b−CD31−Sca1−Integrin-α7+CD34+) in young and aged mice. c Qualitative RT-PCR showing up-regulation of p16Ink4a in aged SCs. HPRT was used as internal control for PCR. d qPCR analysis of relative mRNA levels of Slug in SCs from the young and aged mice (n = 3 mice per group). **p < 0.01 by student’s t-test. e Scheme of SCs repopulation experiment. SCs were passaged weekly. After 2 weeks of culture, SC-derived myoblasts were infected with GFP-control (pMIGR1) or Slug-expressing (pMIG-Slug) retroviruses, and then transplanted into either side of pre-injured TA muscle of mdx recipient. Total mononucleated muscle cells were isolated separately from either TA muscle 4 weeks after transplantation, and subjected to flow cytometric analysis for the frequency of donor-derived SCs (GFP+). f Quantification of relative mRNA levels of p16Ink4a in quiescent and cultured primary mouse SCs with or without overexpressing Slug. *p < 0.05, ***p < 0.001 by one-way ANOVA. g Representative flow cytometric analysis of the fraction of donor-derived SCs (pMIGR1 or pMIG-Slug) within the total recipient MuSC (CD45−CD31−Sca1−Vcam I+) subpopulation in mononucleated TA muscle cells. h Percent of donor-derived cells (GFP+) in total recipient MuSC (CD45−CD31−Sca1−Vcam I+) subpopulation of TA mononucleated muscle cells from mdx recipients (n = 3–4). ***p < 0.001 by student’s t-test. i Representative dystrophin immunostaining (Scale bar, 50 µm) on TA muscles transplanted with pMIGR1 or pMIGR1-Slug retrovirus-infected myoblasts. j Quantification of dystrophin-expressing myofibers in TA muscles of recipient mdx mice (n = 6 mice per group) shown in i. ***p < 0.001, Student’s t-test. Data are shown as mean ± SEM of three independent replicates. Unprocessed gel blots are provided in the Supplementary Fig. 14 and source data file. Also see Supplementary Fig. 13. Source data are provided as a Source Data file

