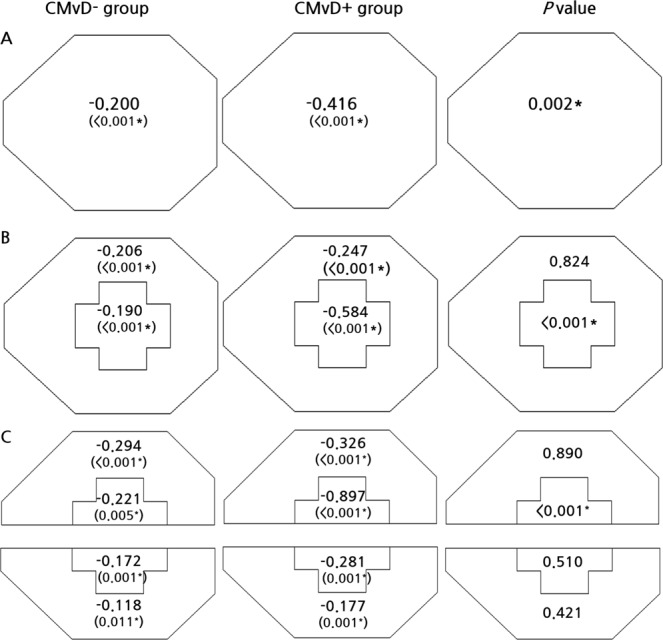
Figure 1.

The global region (A), central 10° and peripheral 10° to 24° region (B) and superior and inferior regions of central 10° and peripheral 10° to 24° (C) in the choroidal microvasculature dropout (CMvD)− and CMvD+ groups, after adjusting for covariates. Significant rates of progression in these three maps were defined as negative slopes with P < 0.05, P < 0.025, and P < 0.0125, respectively. P value diagrams were evaluated using a linear mixed effects model with random effect variances, in which covariates were age, gender, spherical equivalent, central corneal thickness, mean follow-up intraocular pressure, visit-to-visit intraocular pressure fluctuation, and baseline mean deviation. In comparing two groups, a P value < 0.05 was considered statistically significant using a linear mixed effects model. Data are presented as means (dB/year). *Statistically significant using a linear mixed effects model.
