Figure 5.
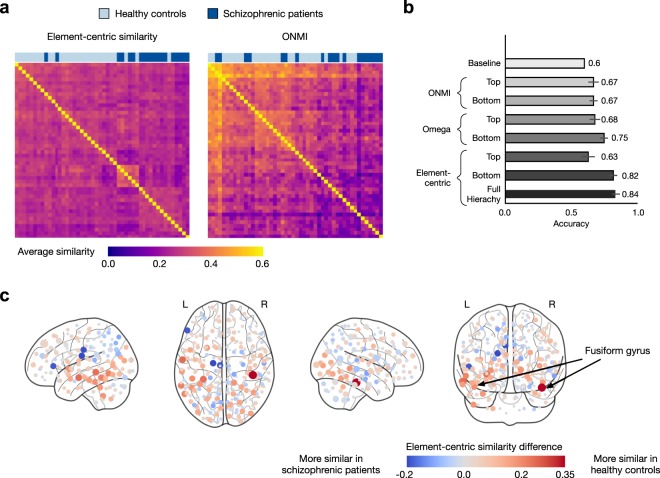
Our element-centric similarity better differentiates the overlapping and hierarchical community structure of functional brain networks in healthy and schizophrenic individuals. (a) Hierarchical clustering of average pair-wise element-centric similarity using the entire OSLOM hierarchy closely reflects the true classification of participants as healthy (light blue) or schizophrenic (dark blue), while hierarchical clustering of the average pair-wise similarity using ONMI on the bottom level of the OSLOM hierarchy fails to uncover patient classification. (b) Classification accuracy using different clustering similarity measures averaged over 100 instances of 10-fold cross-validation, error bars denote one standard deviation. (c) The difference in element-centric similarity for each brain region when comparing amongst the healthy controls minus the similarity when comparing amongst the schizophrenic individuals; ROIs within the Fusiform gyrus are more consistently clustered in the healthy controls than in the schizophrenic individuals.

