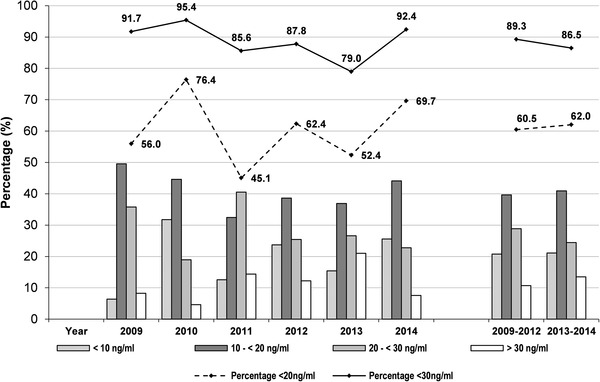
Fig. 2.

25(OH)D distribution (%) in each year according to the four different vitamin D classification stages. In addition, the percentage of samples not reaching 25(OH)D levels ≥ 20 ng/ml or ≥ 30 ng/ml (upper part) is shown

25(OH)D distribution (%) in each year according to the four different vitamin D classification stages. In addition, the percentage of samples not reaching 25(OH)D levels ≥ 20 ng/ml or ≥ 30 ng/ml (upper part) is shown