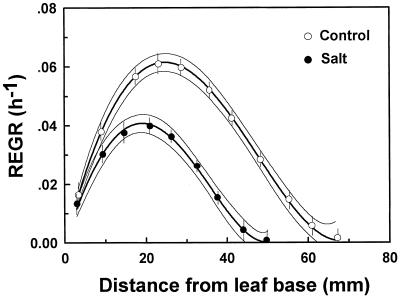
Figure 2.
Spatial distribution of REGR along the elongation zone of maize leaves growing at 1 mm NaCl (control) or 80 mm NaCl (salt). Data evaluated from prick hole-marking experiments of leaf 4 of maize. Data represent means ± se (n = 10); regression curves are fourth order polynomials, with 95% confidence interval fitted to the original unaveraged segmental R data. The numerical methods are detailed in “Materials and Methods.”

