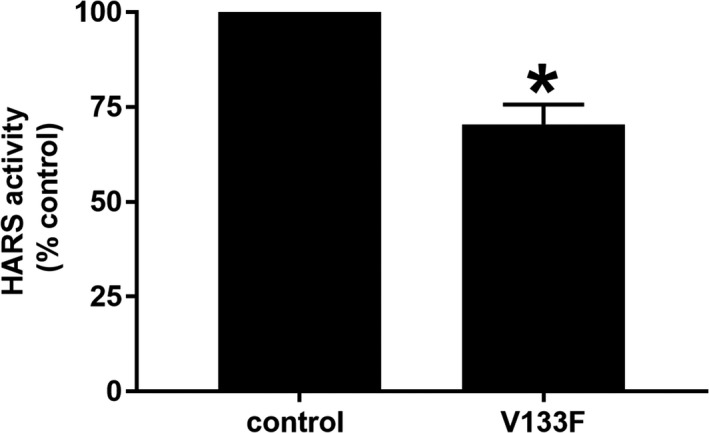
Figure 4.

Analysis of HARS activity in control and V133F patient dermal fibroblasts. HARS activity in cell extracts was determined by calculating the slope of product formed over time. Activity was significantly reduced (~25%) in V133F patient cells. Data are displayed as mean ± SEM (n = 3). * indicates P < 0.05 by two‐tailed unpaired t‐test
