
Figure 5.
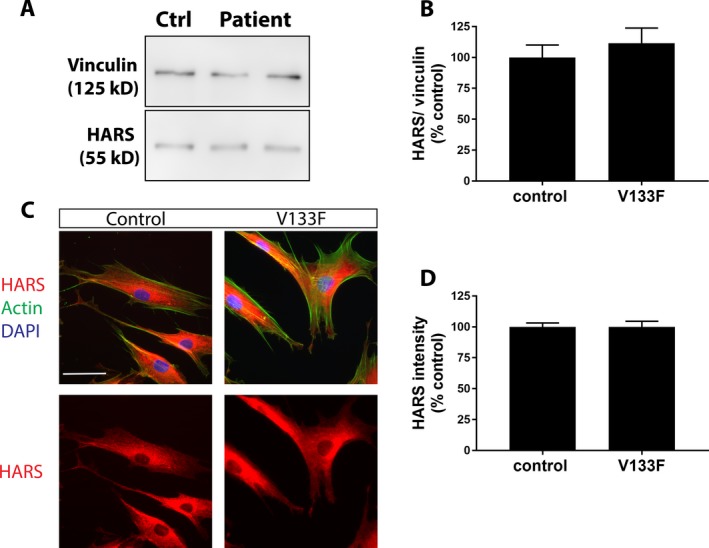
(A–D) HARS western blotting and immunofluorescence microscopy in control and V133F patient dermal fibroblasts. Expression of HARS at the protein level is similar in control and V133F patient cells as determined by western blotting (A, B) and immunofluorescence imaging (C, D). HARS protein localizes primarily perinuclearly, and throughout the cytoplasm in both control and patient cells (C). Data are displayed as mean ± SEM (western blot n = 3; imaging n = 48 control cells, 52 patient cells). Scale bar = 50 μm.