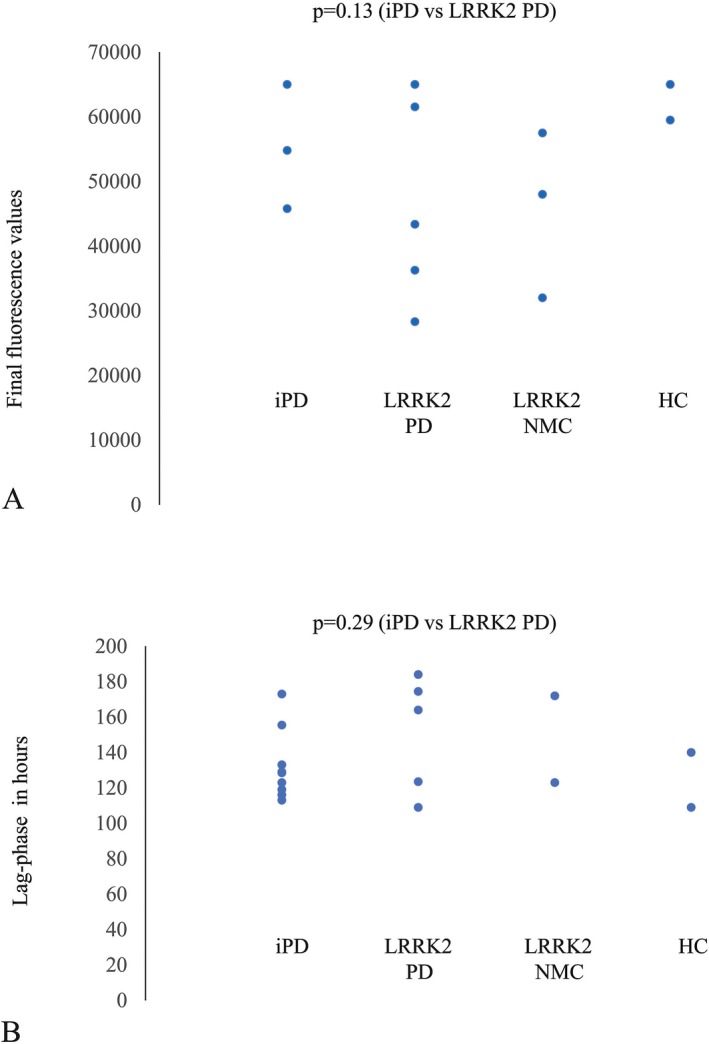
Figure 1.

Final fluorescence values (A) and Lag‐phase (B) of positive a‐syn RT‐QuIC subjects in IPD, LRRK2‐PD, LRRK2‐NMC and healthy controls (HC). All but two of the IPD patients with positive RT‐QuIC had final fluorescence values of 65,000, with the remaining two patients having values of 54,801 and 45,792, respectively. The seven IPD that had final fluorescent values of 65,000 are represented by a single point on Figure 1A. Among the LRRK2‐PD patients with positive RT‐QuIC two patients had a final fluorescence value of 65000 and appear as a single point on Figure 1A. One LRRK2‐PD patient and one LRRK2‐NMC with positive RT‐QuIC had unmeasurable lag‐phases as the final fluorescence values were less than 44,000 in both duplicates and are not represented in Figure 1B.
