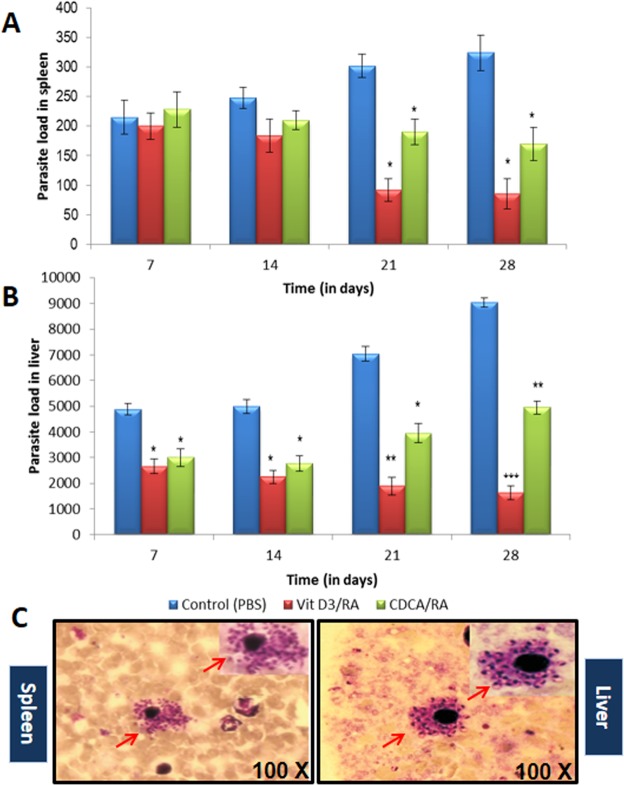
Figure 2.
Comparison of Parasite load in spleen and liver in course of treatment with Vit.D3/RA, CDCA/RA L. donovani infection in BALB/c mice in comparison of control. (A) Parasite load in spleen (B) Parasite load in the liver (C) Giemsa stained micrograph showing macrophages (spleen and liver) infected with L. donovani showing intracellular parasite converted to amastigotes after internalization (100X; indicated by arrowheads). All the treated and control groups mice were sacrificed and Leishman-Donovan units (LDU) were calculated from liver and spleen impression smears. The values represent the mean ± SD difference between the infected and control of experiments. *P < 0.05. **P < 0.005, n = 6.

