Fig. 6.
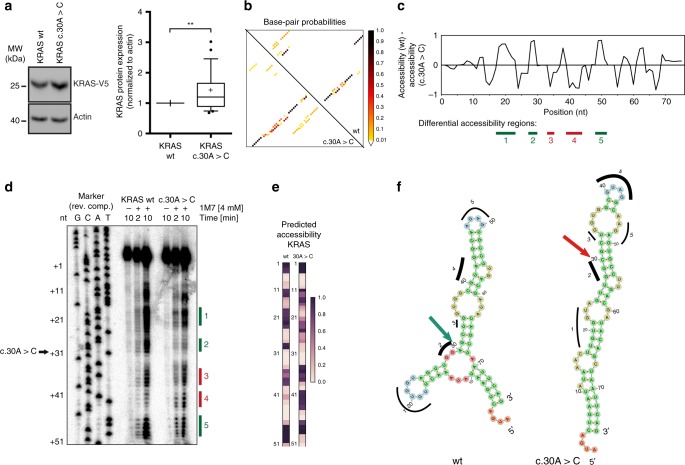
KRAS c.30 A > C affects the transcript secondary structure. a Left: HEK293 cells were transfected with the indicated KRAS-V5 constructs. Expression of the constructs was evaluated by western blotting using anti-V5 and anti-Actin antibodies. Left: a representative experiment is shown. Right: quantification of the western blot from biological replicates (n = 25). V5 signals were normalized to Actin signals presented as boxplot. **p < 0.01 (t-test). b Base-pairing probabilities of the wildtype and mutant sequences are shown. The mutation introduces a stable rod-like duplex (bottom-left), while the stable structure in the wildtype forms branching stems (top-right). c The change in nucleotide accessibility is depicted by the difference between the predicted accessibility along the KRAS wildtype vs. mutant transcripts. d In vitro SHAPE probing of KRAS wildtype (WT) and c.30 A > C mutant KRAS using 1M7 shows differential nucleotide accessibility profiles. Lanes 5–7 and lanes 8–10 indicate the SHAPE profile of wildtype KRAS and mutant KRAS (c.30 A > C), respectively. RNA shown in lanes 5 and 8 are treated with DMSO for 10 min and lanes 6/9 and lanes 7/10 correspond to RNA treated with SHAPE reagent 1M7 (4 mM final concentration) for 2 min and 10 min, respectively. Numbered rectangular boxes correspond to regions of predicted local structural accessibility changes as shown in Fig. 6c. Lanes 1–4 represent the sequencing ladder prepared from KRAS DNA as template in complementary sequence. e Heatmaps of nucleotide-wise accessibility predicted in silico for comparison with SHAPE. f Representation of the secondary structures with minimum free energy by RNAfold for KRAS wildtype and mutant RNAs used for SHAPE

