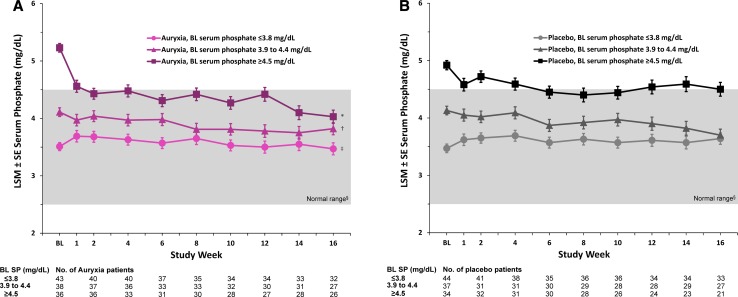
Fig. 7.
Changes in mean serum phosphate levels stratified by tertiles of baseline serum phosphate levels. a Patients treated with Auryxia. b Patients who received placebo. BL baseline, LSM least squares mean, SP serum phosphorus. Data are LSM (SE) serum phosphate estimates derived from a mixed-effects model for repeated measures analysis with fixed-effects terms for treatment (Auryxia vs placebo), baseline covariate, visit, treatment-by-visit interaction, treatment-by-covariate interaction, and treatment-by-visit-by-covariate interaction. *p = 0.006, †p = 0.438, and ‡p = 0.236 vs placebo. §The normal laboratory reference range of serum phosphate levels is indicated by the gray background.
Adapted from Block et al. [105]

